Changelog

Follow new updates and improvements to octoja GmbH.

July 27th, 2026

New

Improved

Fixed

Highlights

This release adds four new monitoring checks — disk-space trend, file size, CPU temperature and Synology NAS backups — so you catch storage, heat and backup problems earlier. A new SLA report turns your check history into incident counts, resolution times and uptime, and a report widget lists every check that no alerting covers. The rest is polish and reliability — a much sturdier TANSS integration, finer-grained permissions, and a long tail of check fixes.

New

  • Disk Space Change check — Tracks how much the free space on a drive changes over a period you choose, with thresholds in MB or as a percentage. It also projects when the drive will fill up and plots the trend.
  • File Size check — Alerts you when a specific file crosses an upper or lower size threshold.
  • Synology Backup check — Monitors Hyper Backup, Active Backup for Business and Active Backup for Microsoft 365 jobs on your Synology NAS, and alerts you on stale or failed backups and unreachable targets.
  • CPU Temperature check — Warns you from the device's own sensors when it runs too hot. Set Warning and Critical in °C (80 and 90 by default), and choose whether a device with no sensor at all raises a warning or is skipped.
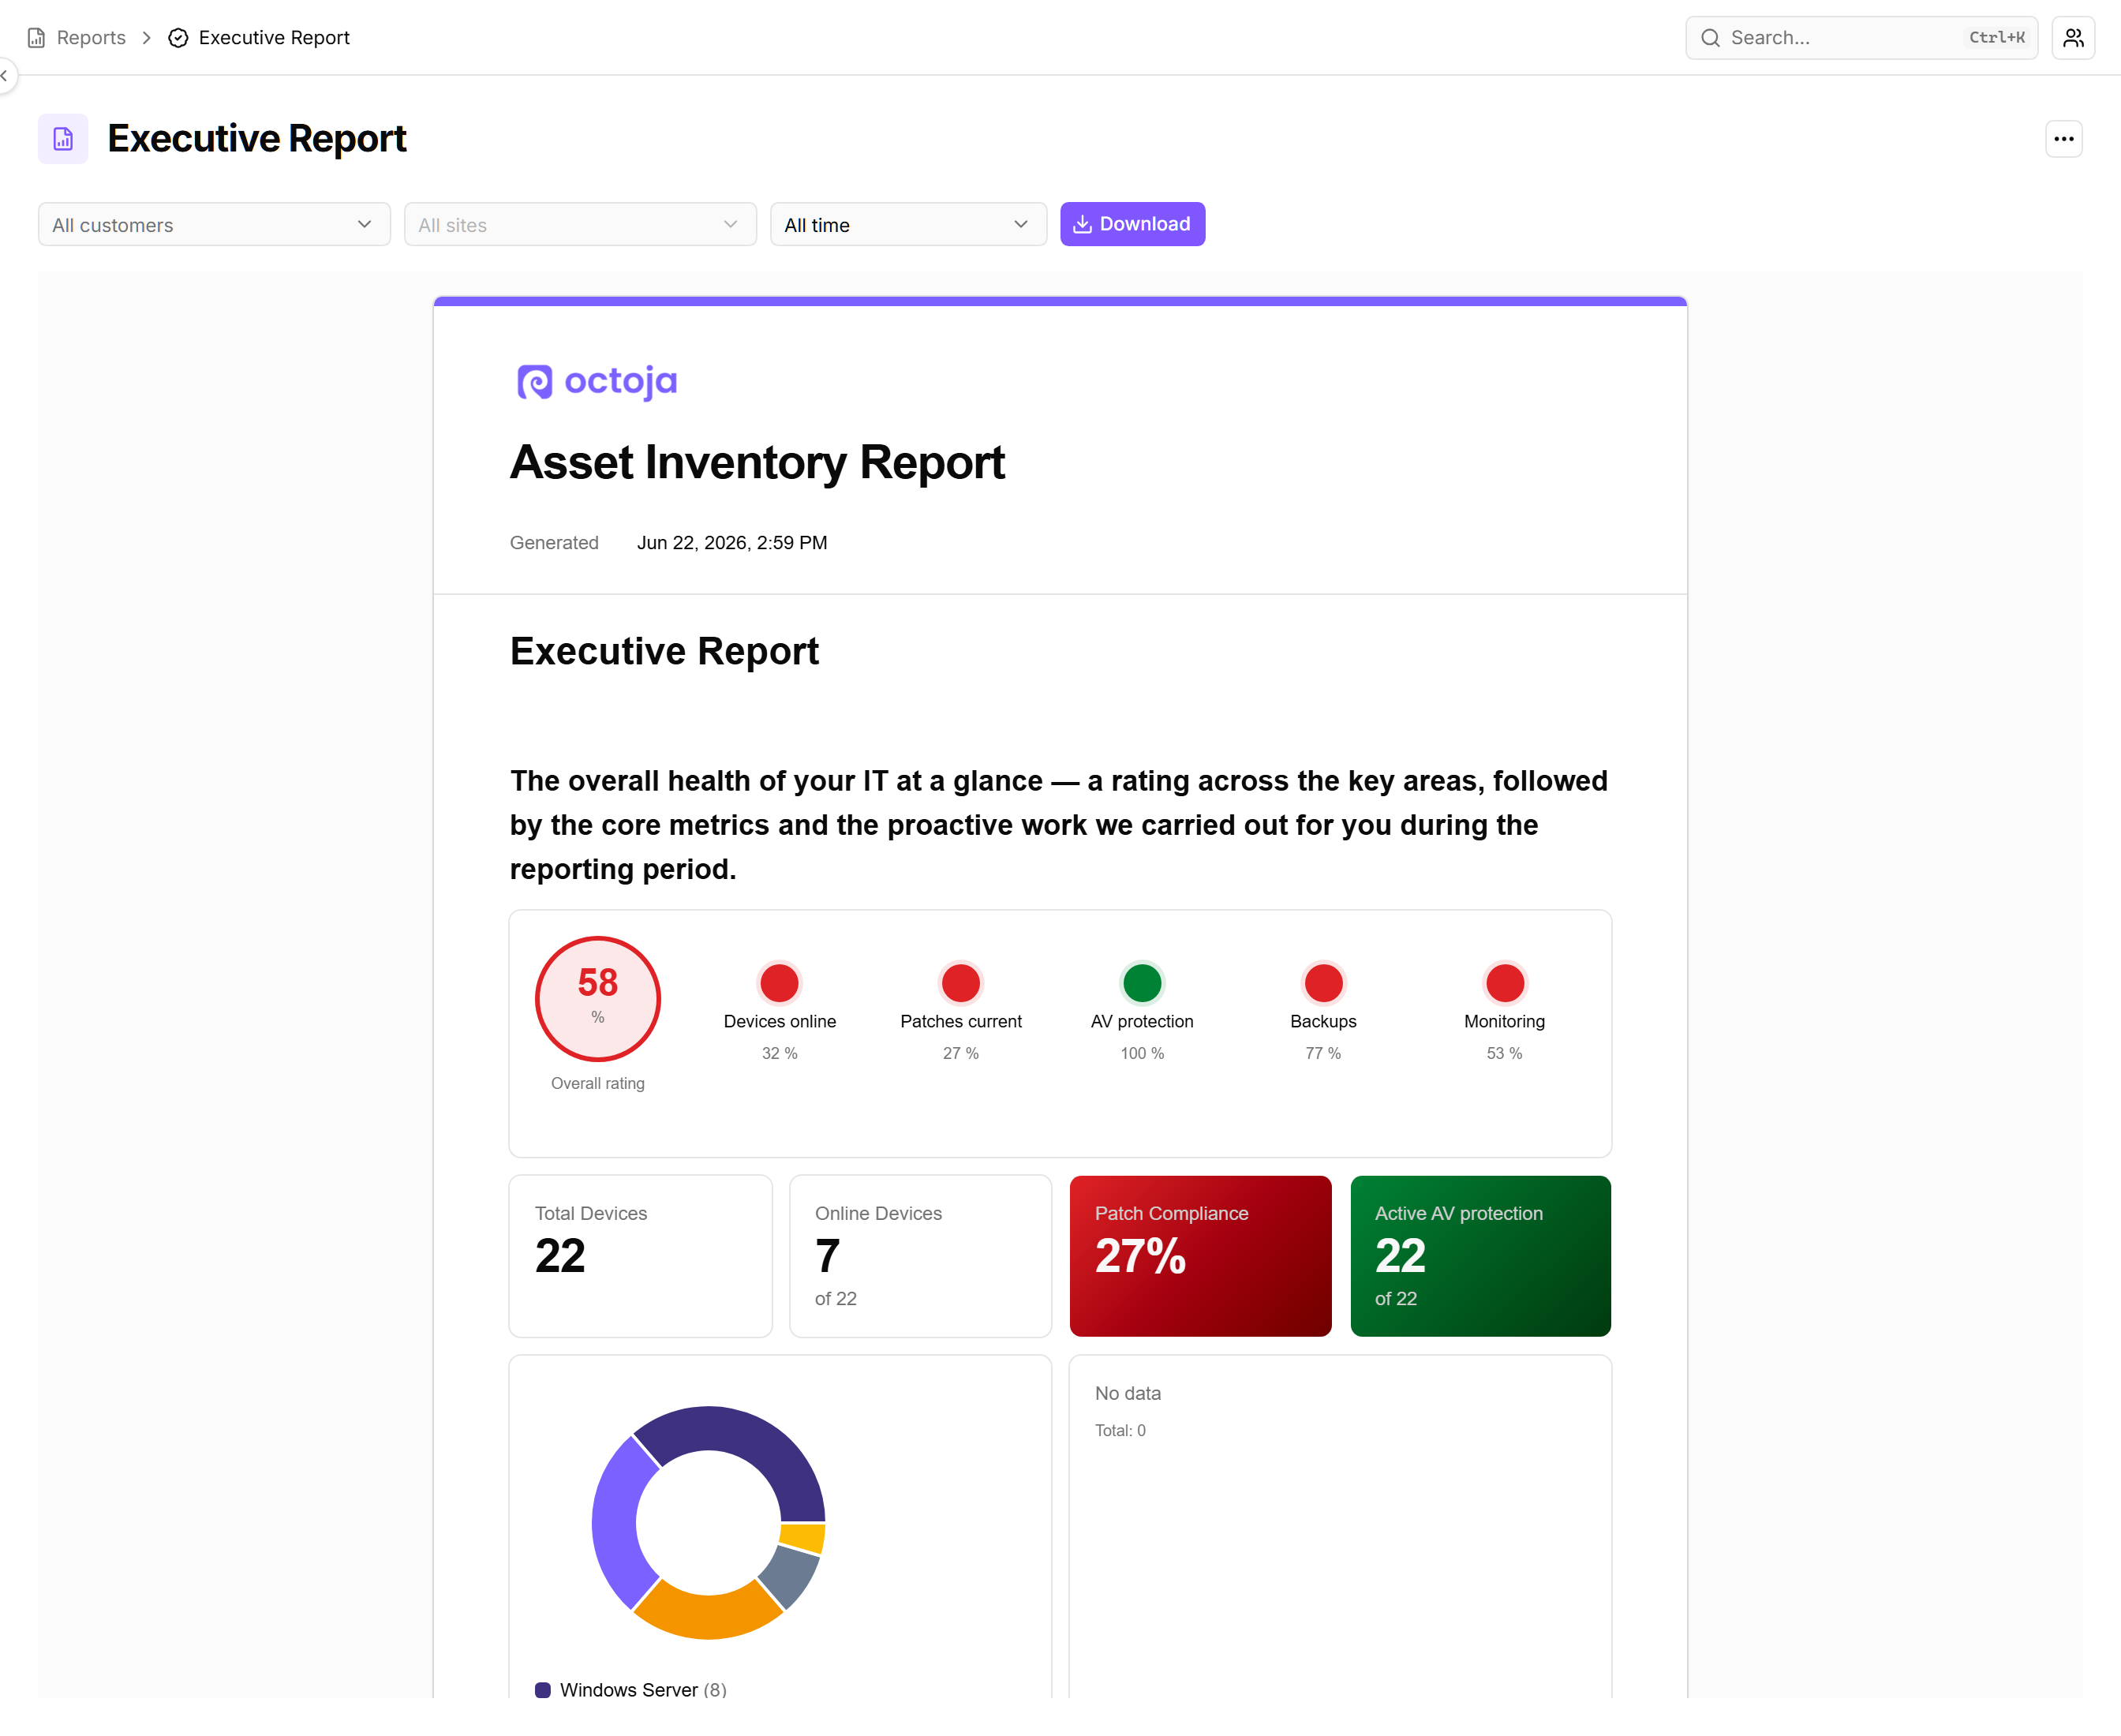
  • SLA report — Shows incident count, mean time to resolve and time-weighted uptime, plus a timeline of check failures and recovery times. Check results are kept for 30 days.
  • Checks without alerting — report widget — Lists every active check that no alerting covers, with a Source column showing whether it came from a shared configuration package or was added individually.
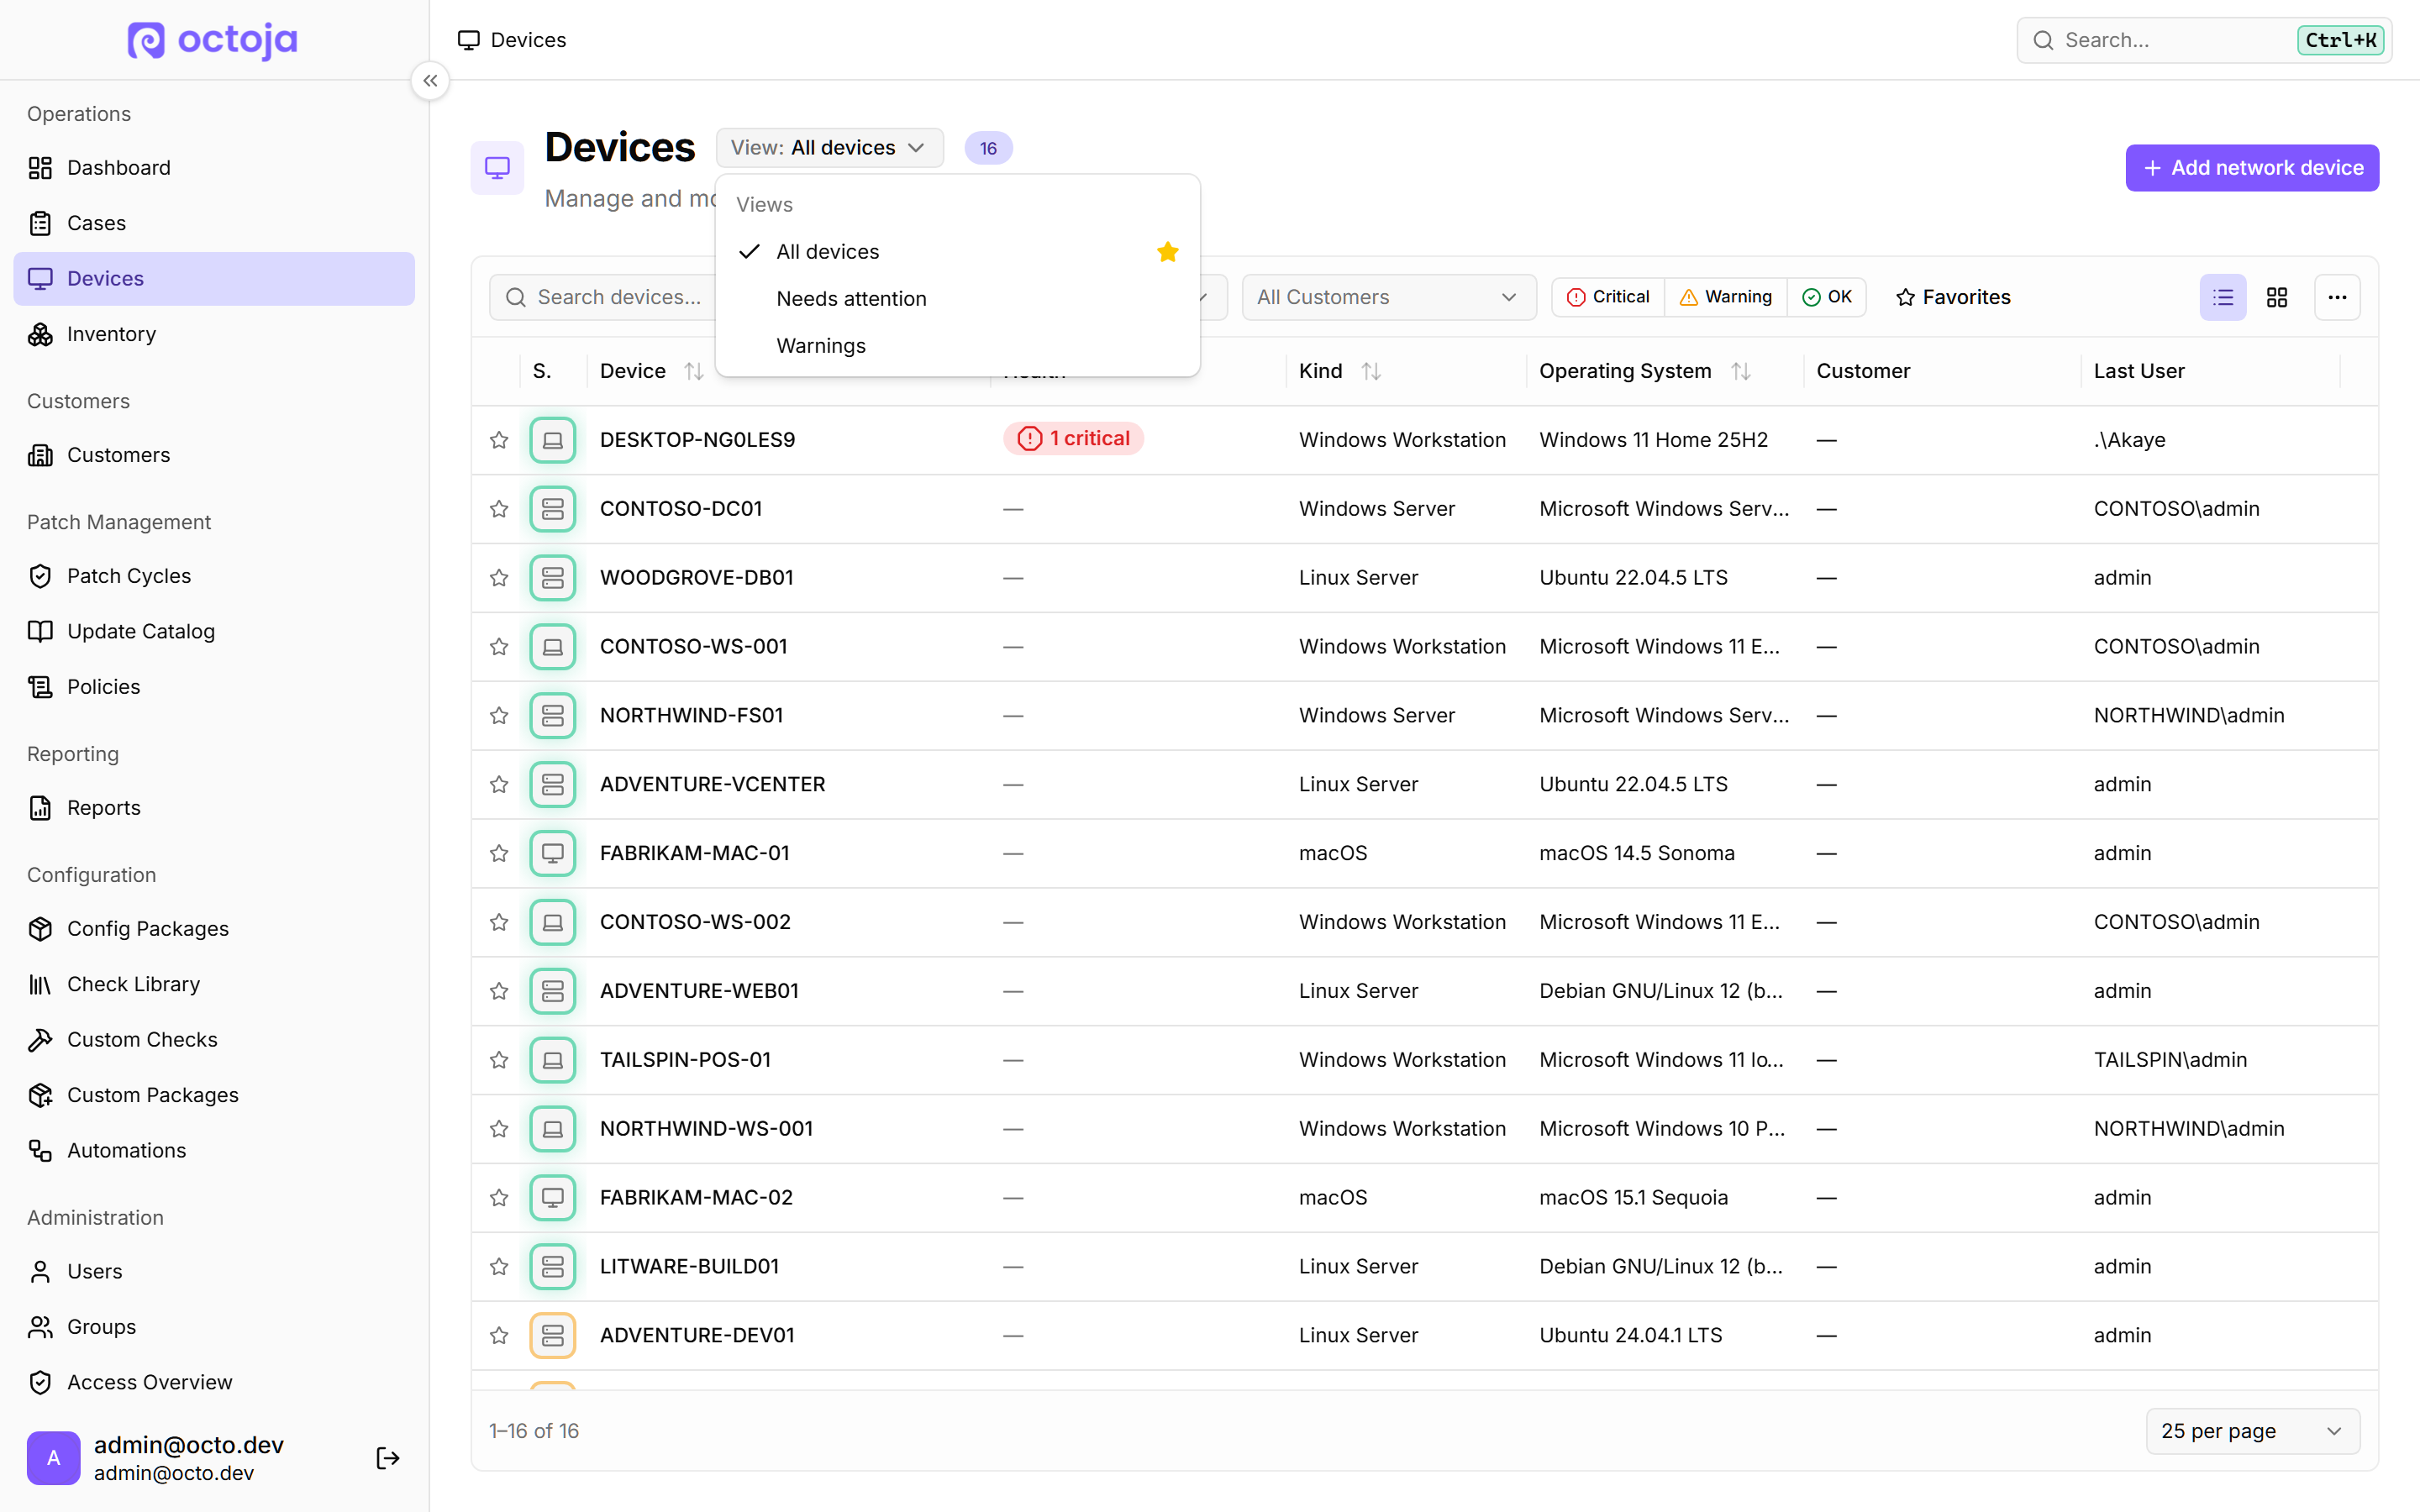
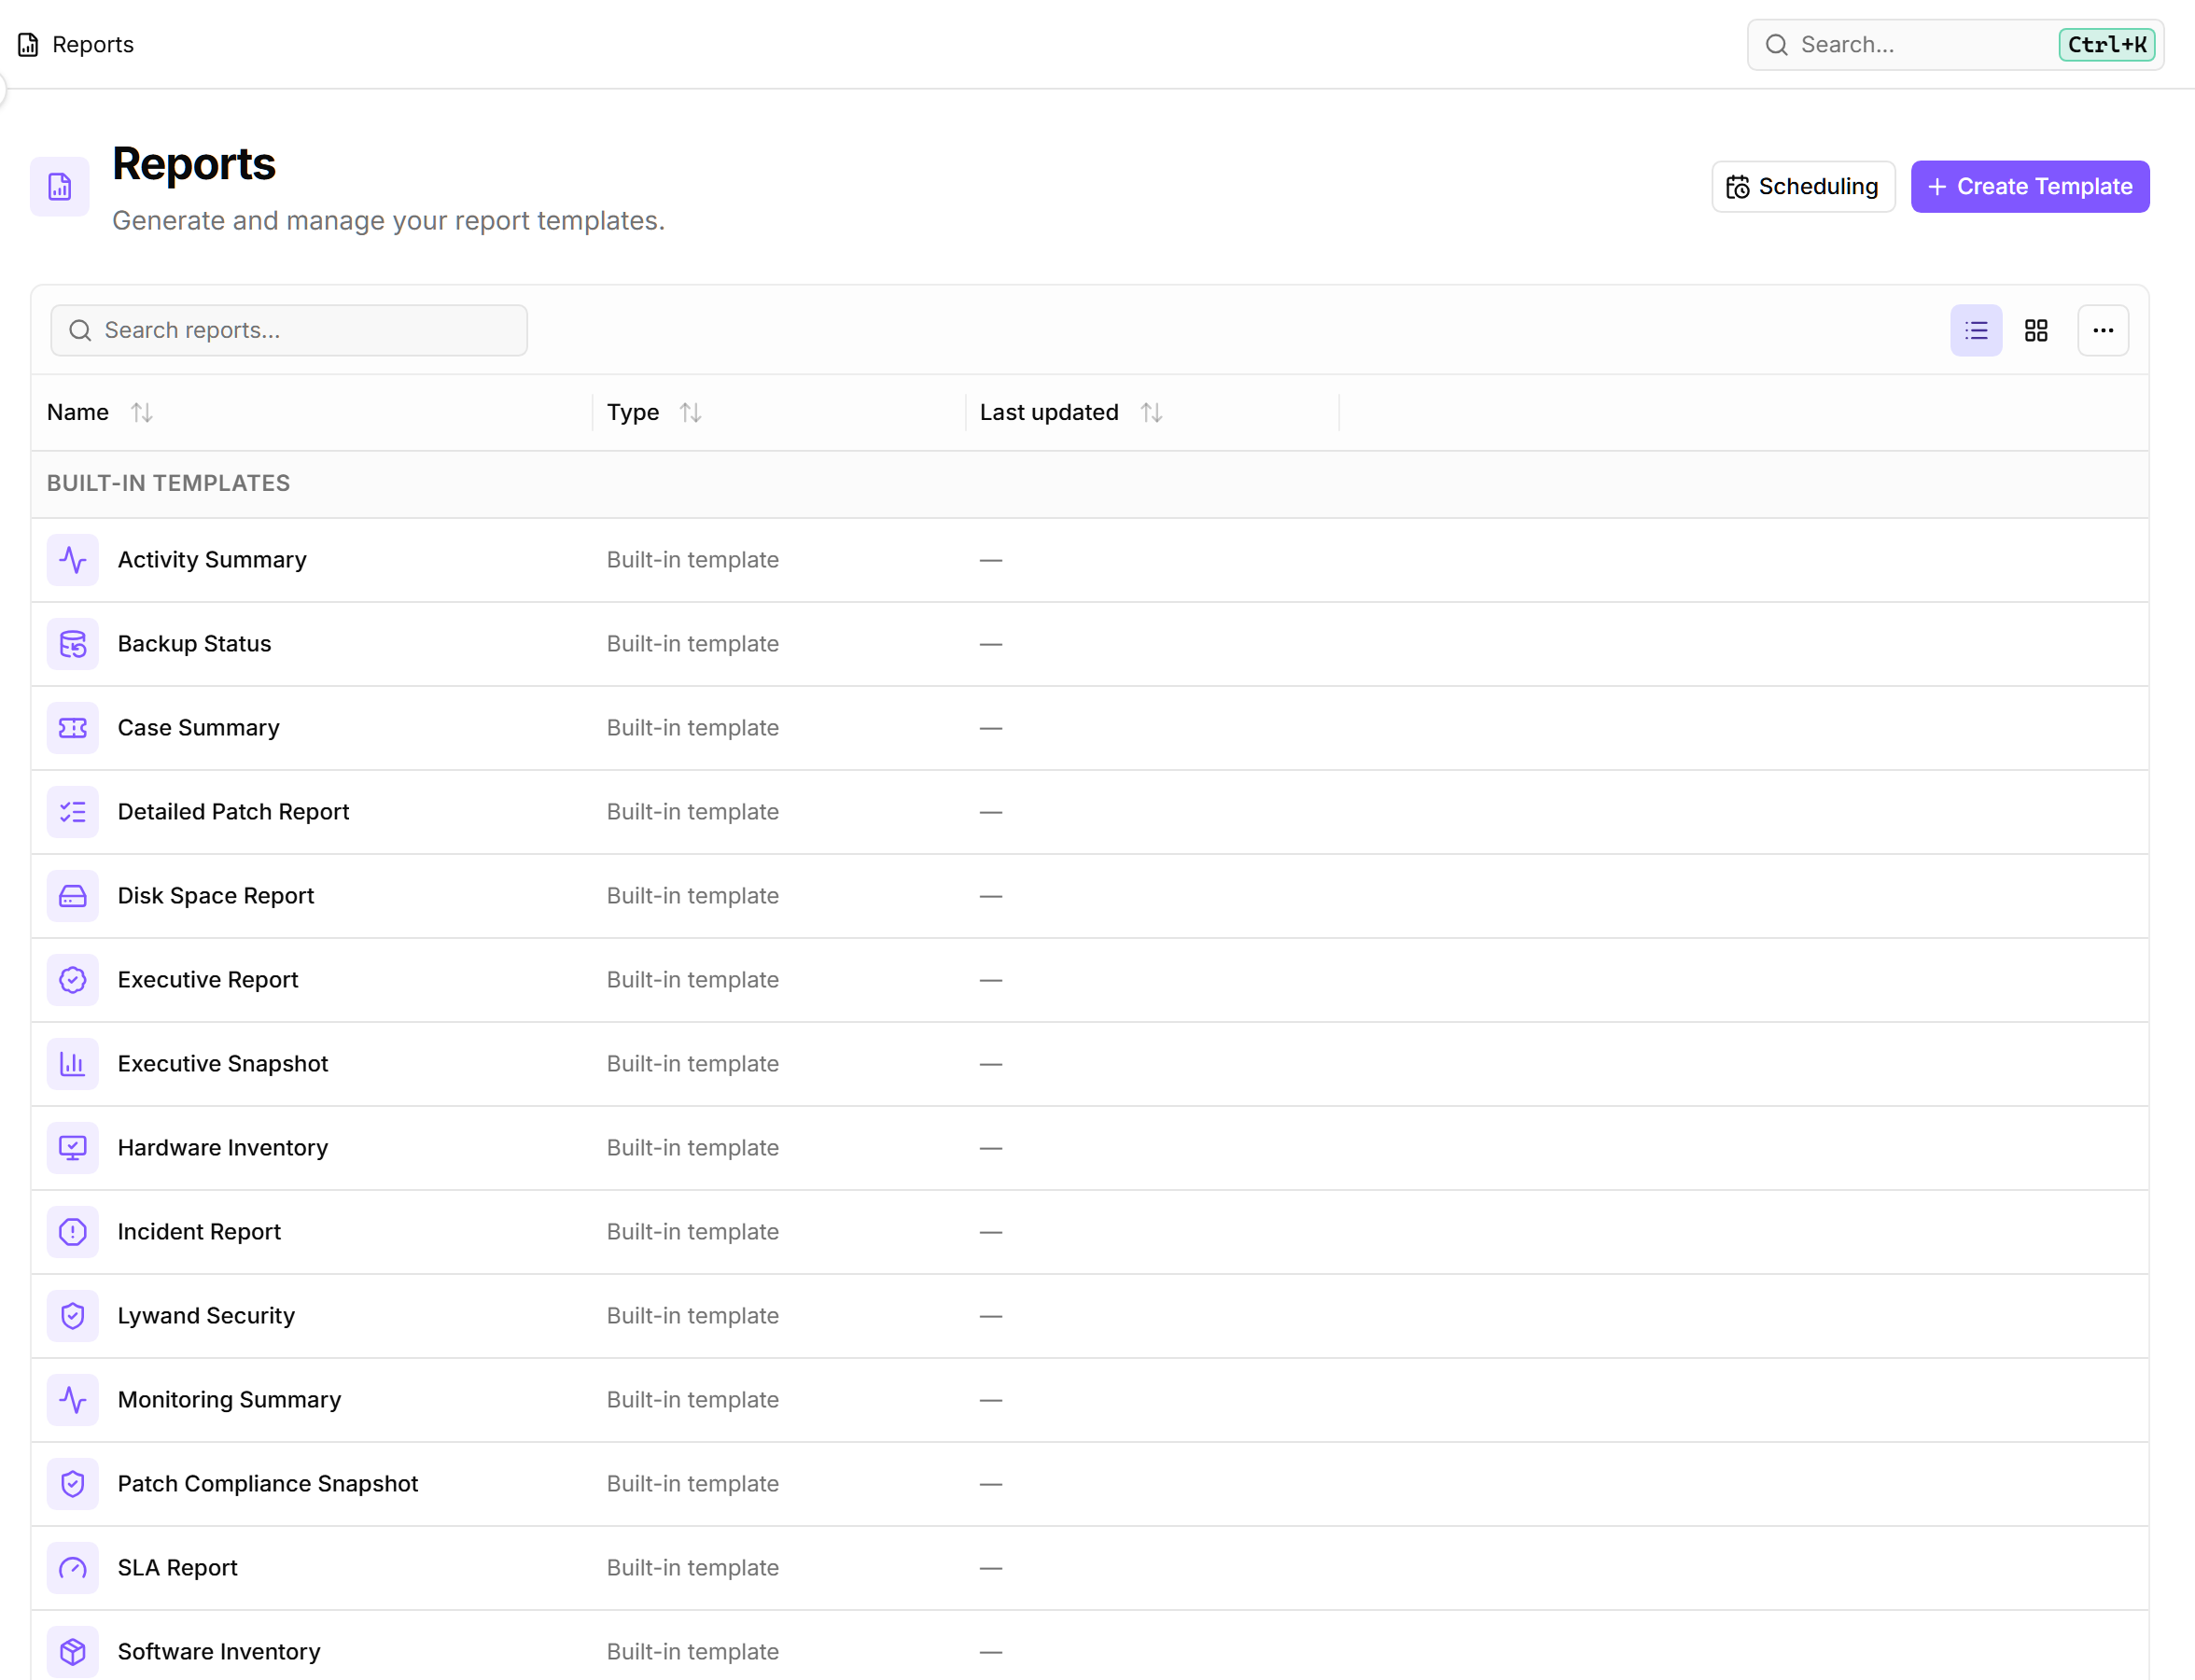
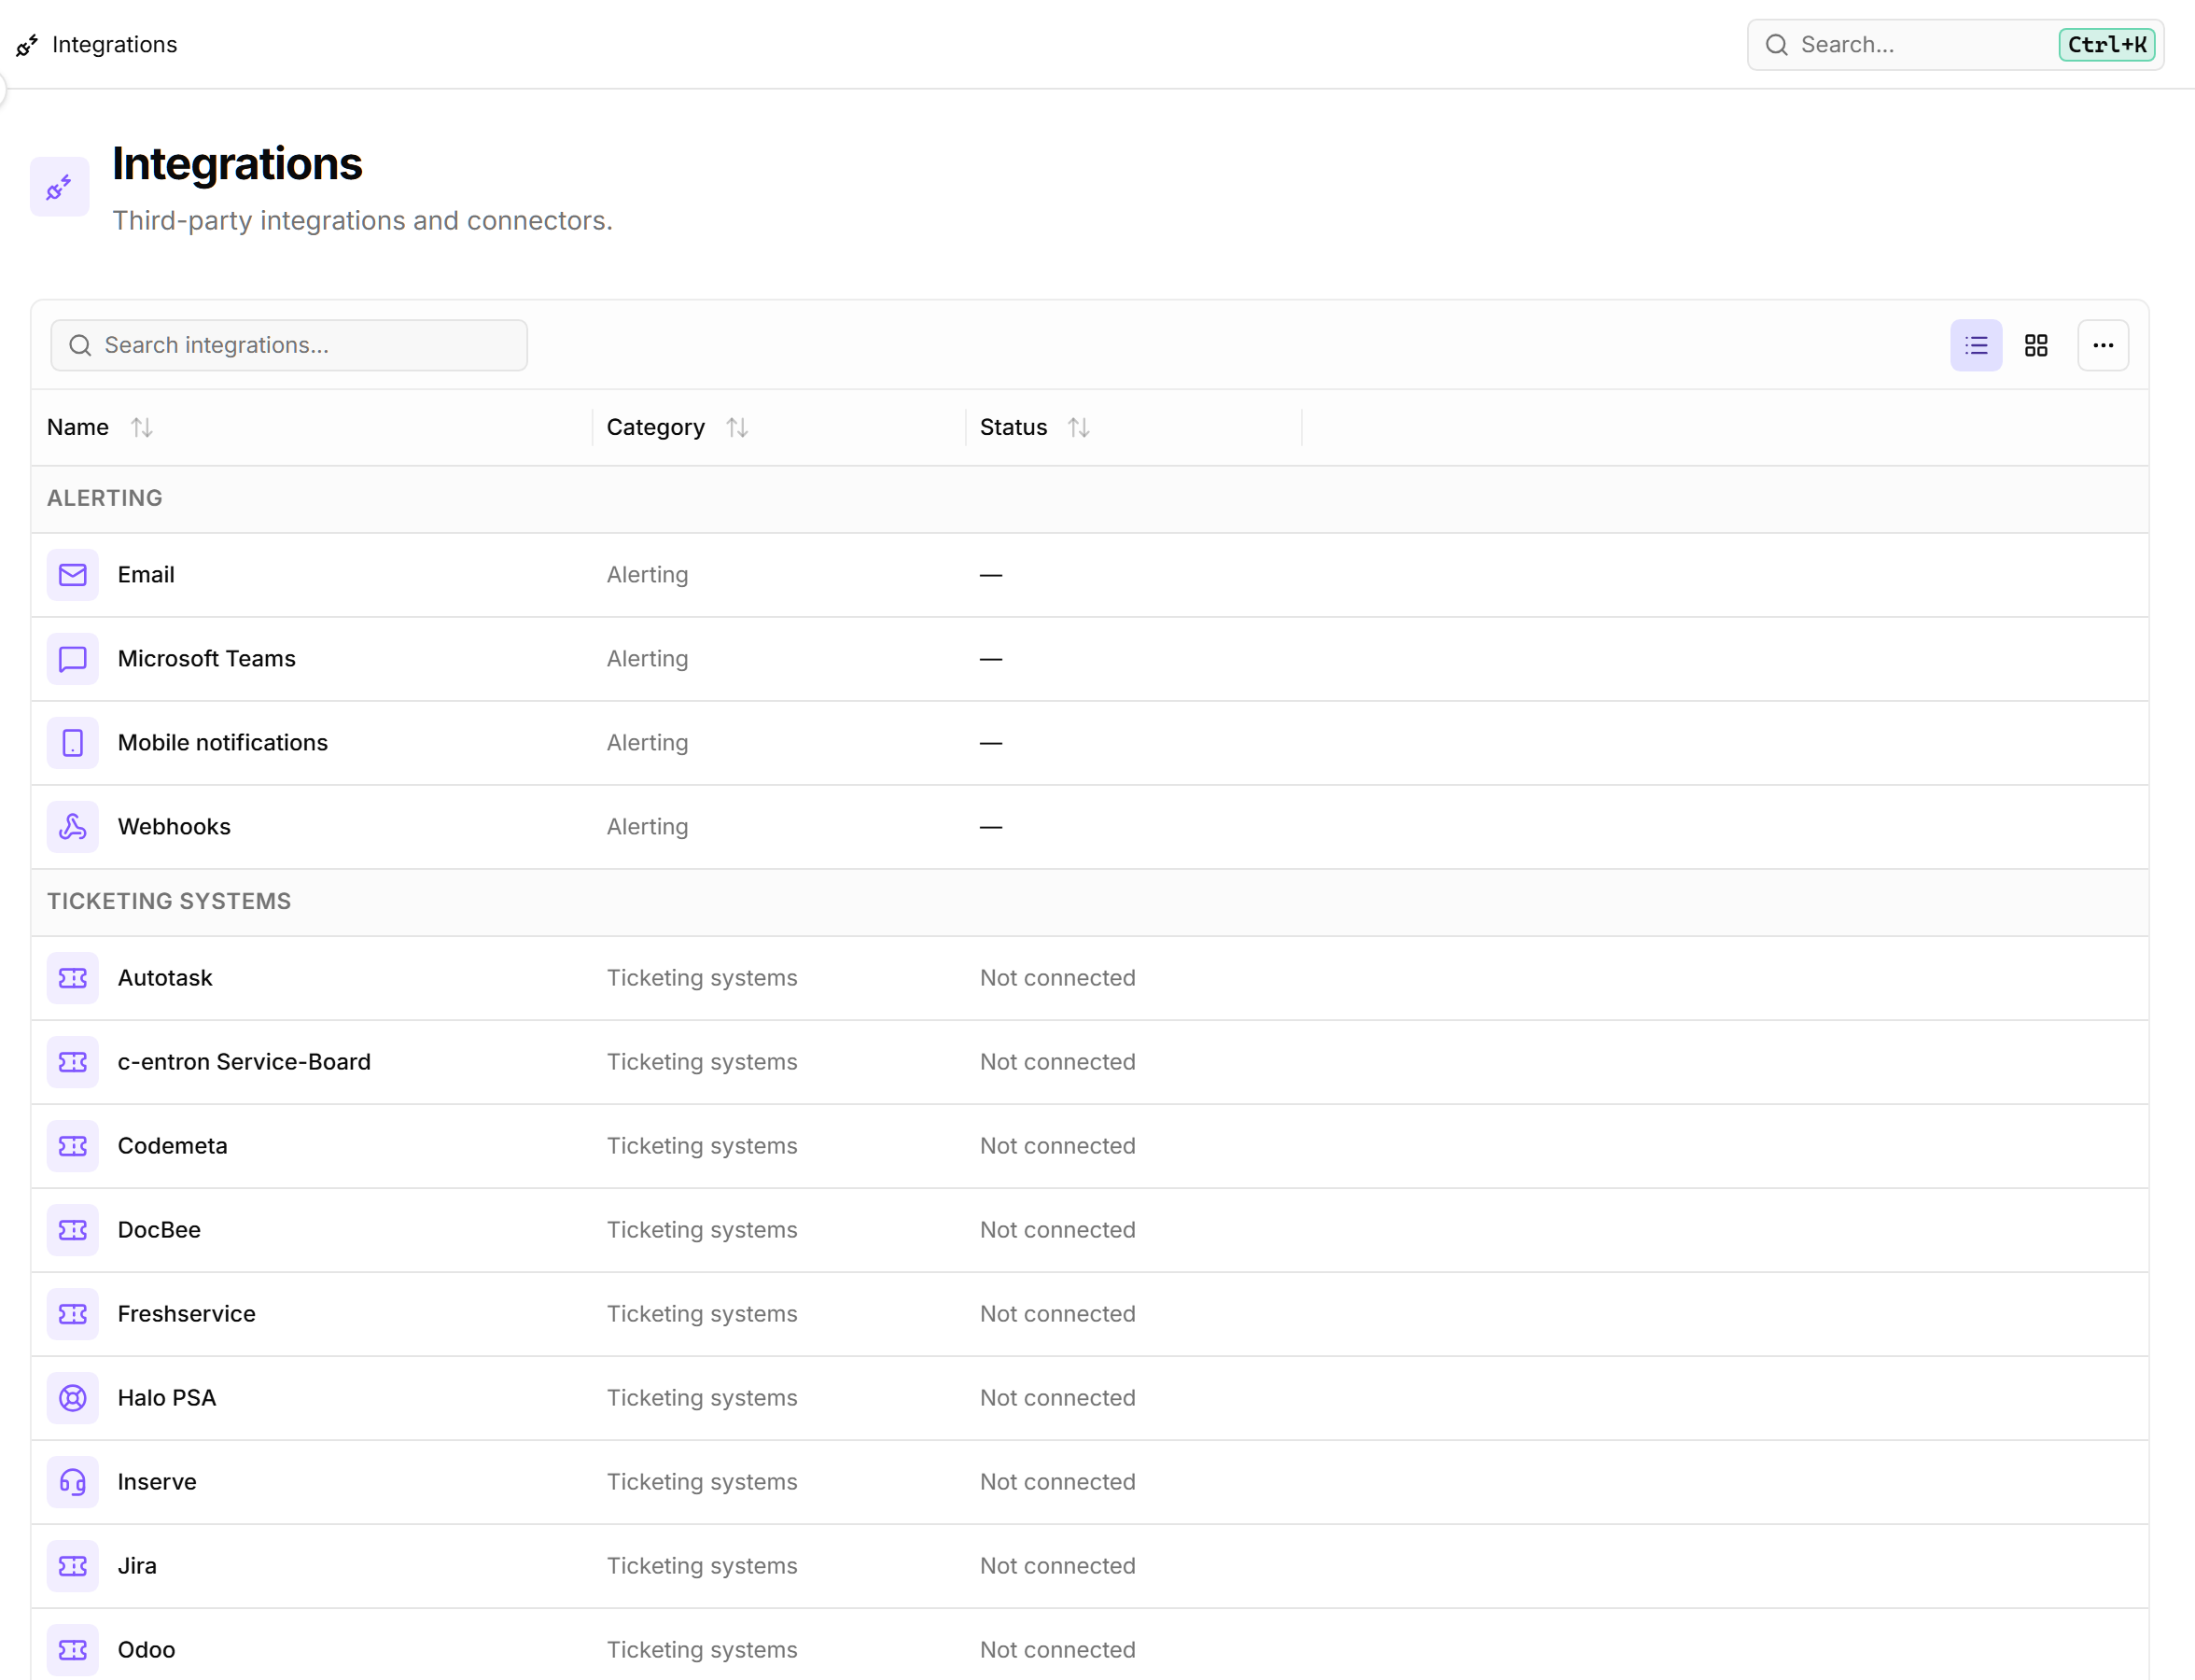
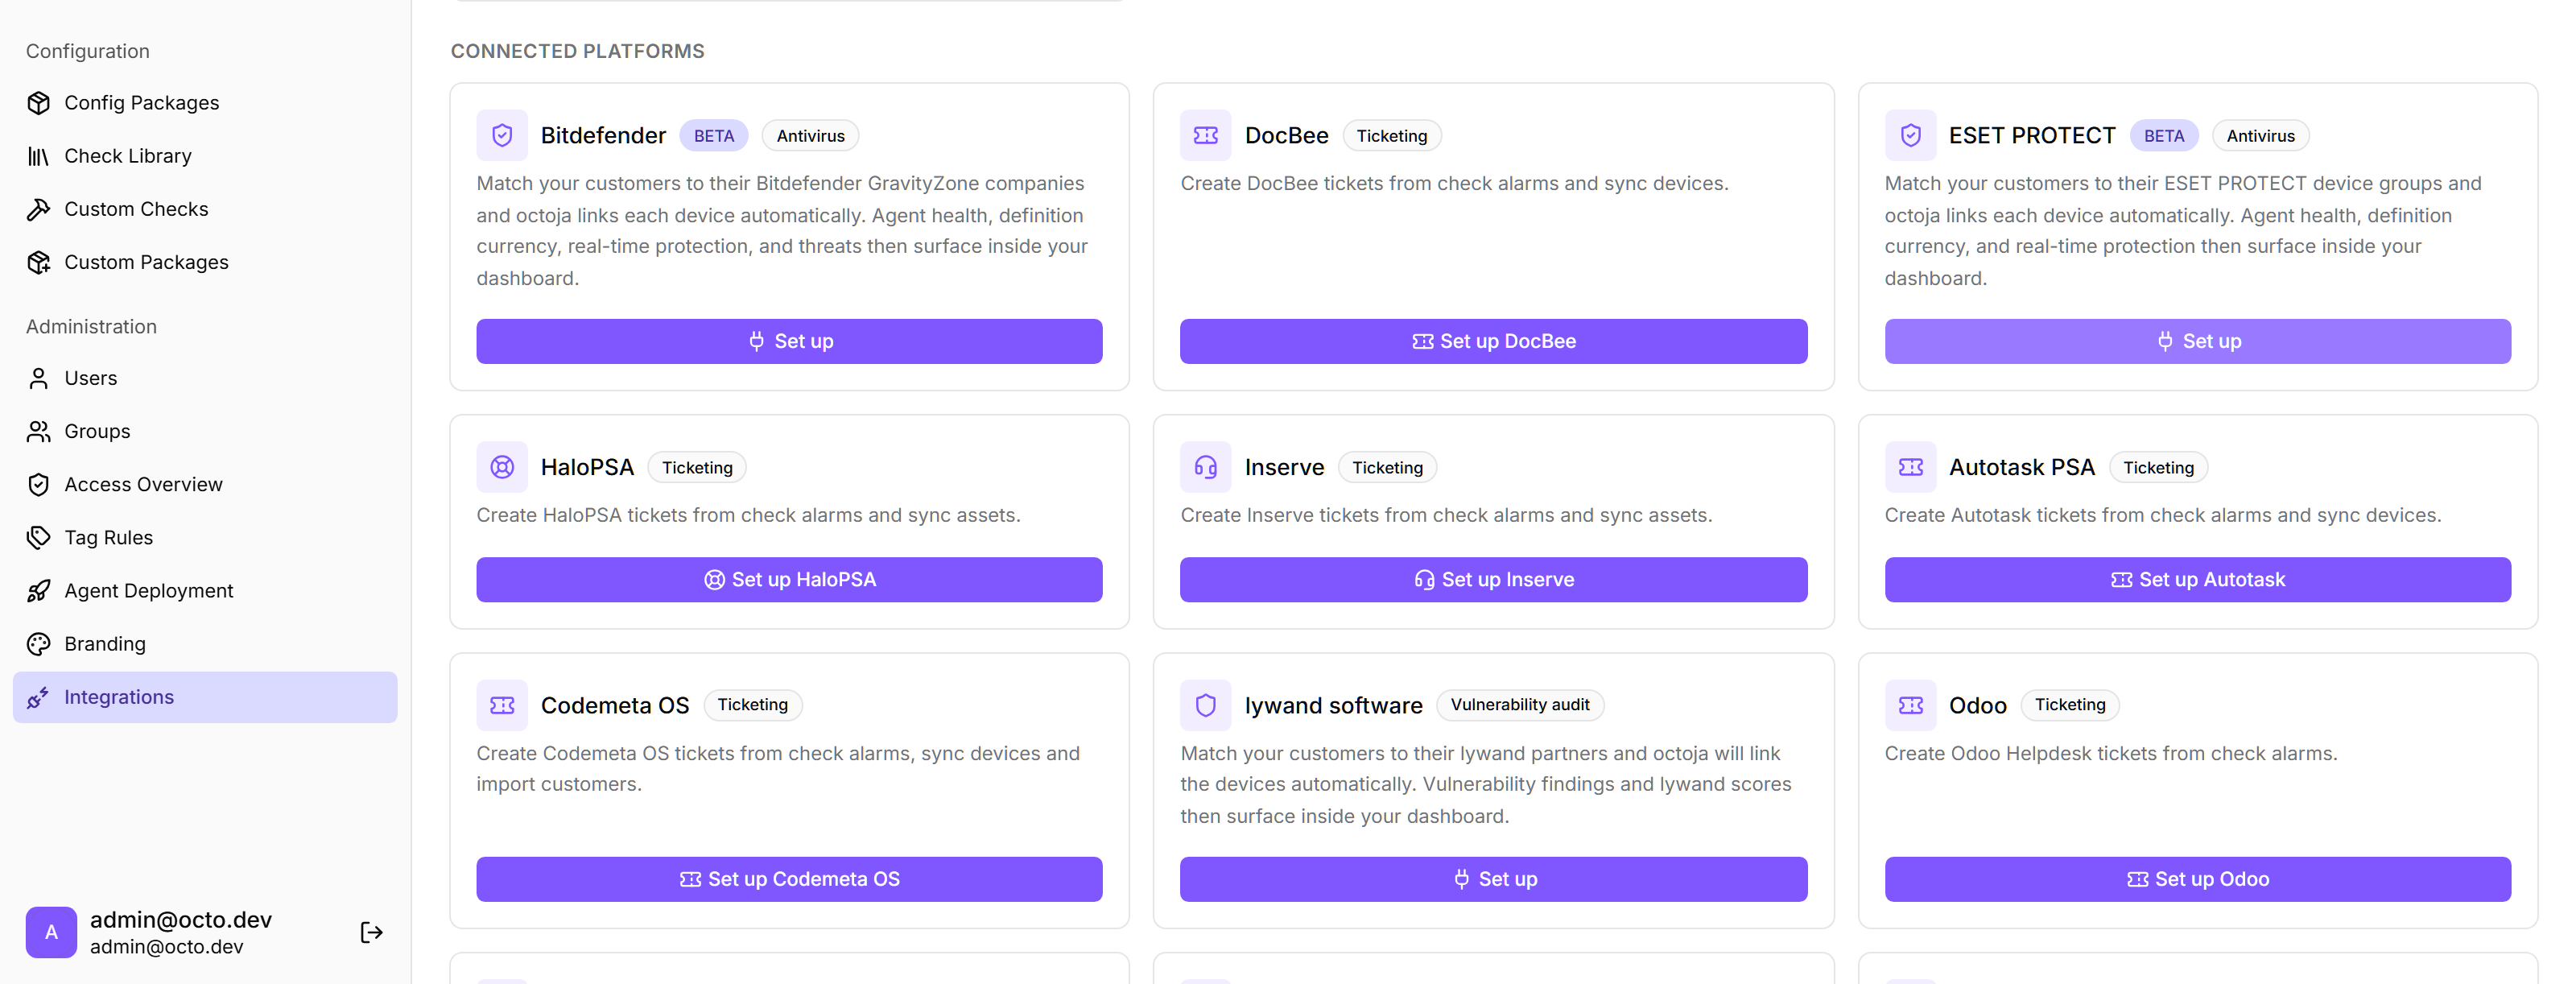
  • List view on Reports, Custom Checks and Integrations — All three pages gain a cards/table toggle in the toolbar, with cards staying the default.
    List view on Reports, Custom Checks and Integrations
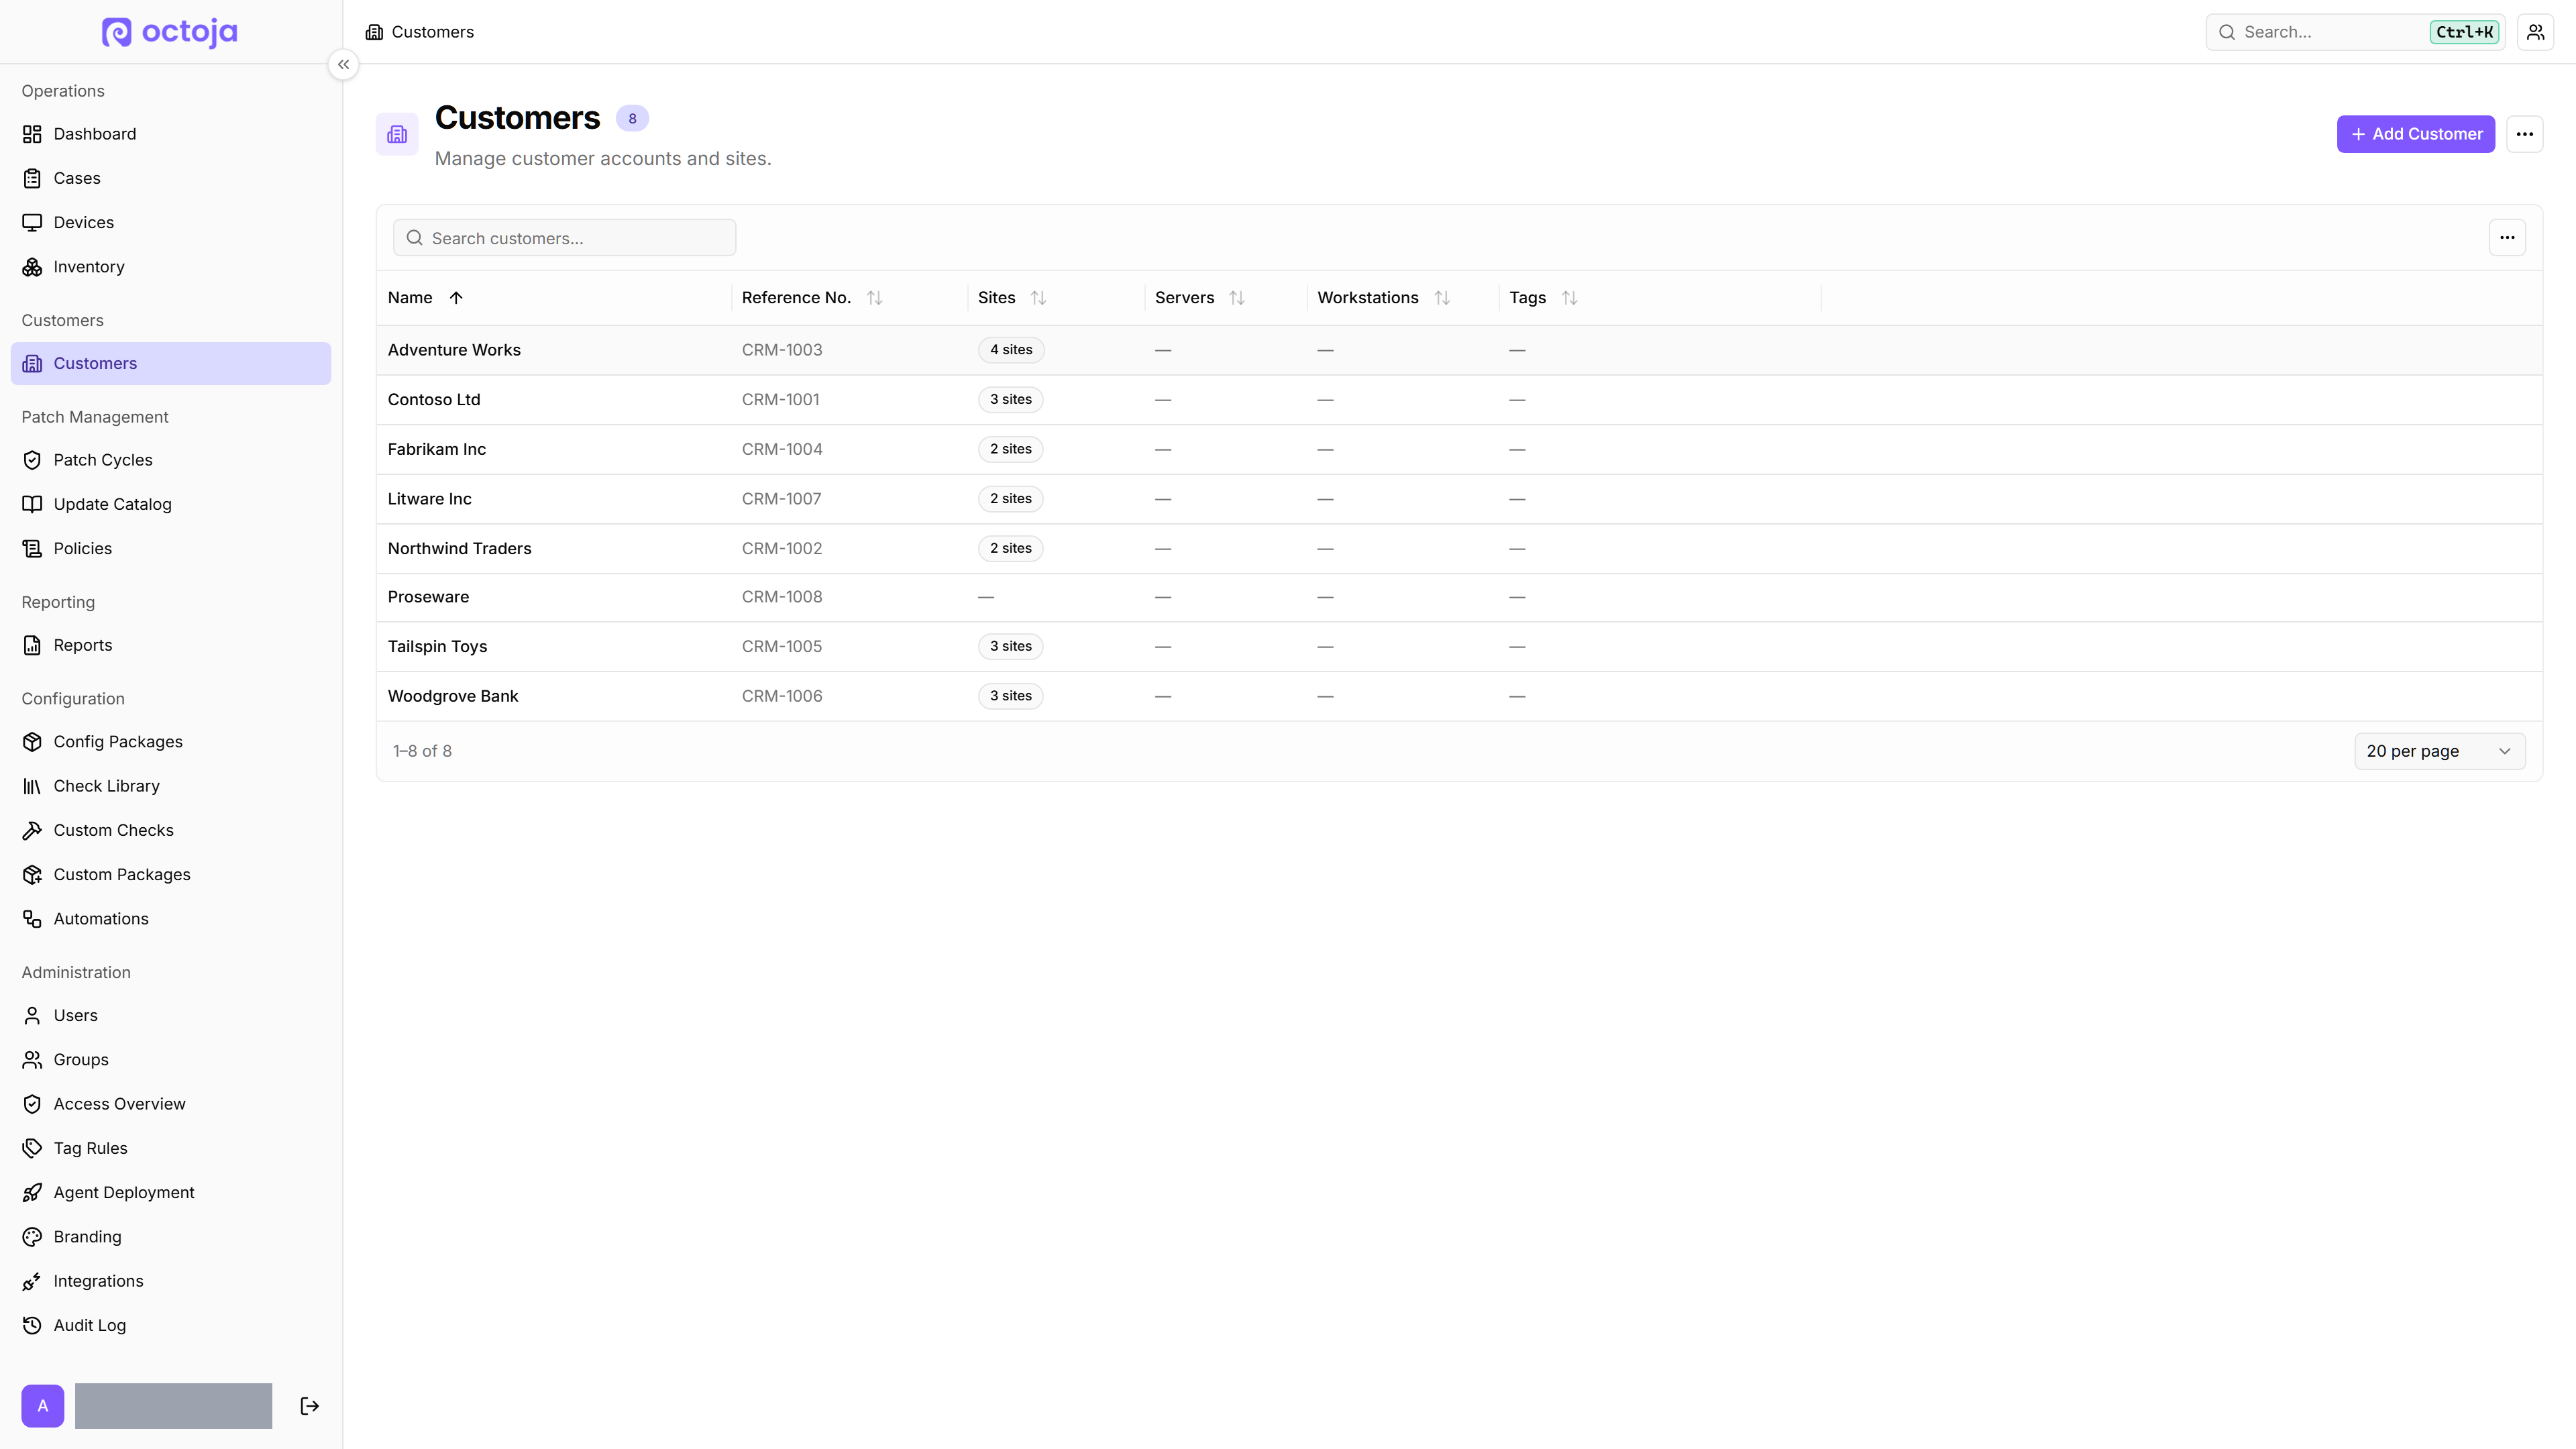
  • Device counts per customer site — The customer dashboard now shows a searchable, sortable table of the customer's sites with the number of devices you can reach at each.
  • "No Customer" device filter — The device list's customer filter gains a “No Customer” entry; previously you could reach these devices only through the dashboard tree.
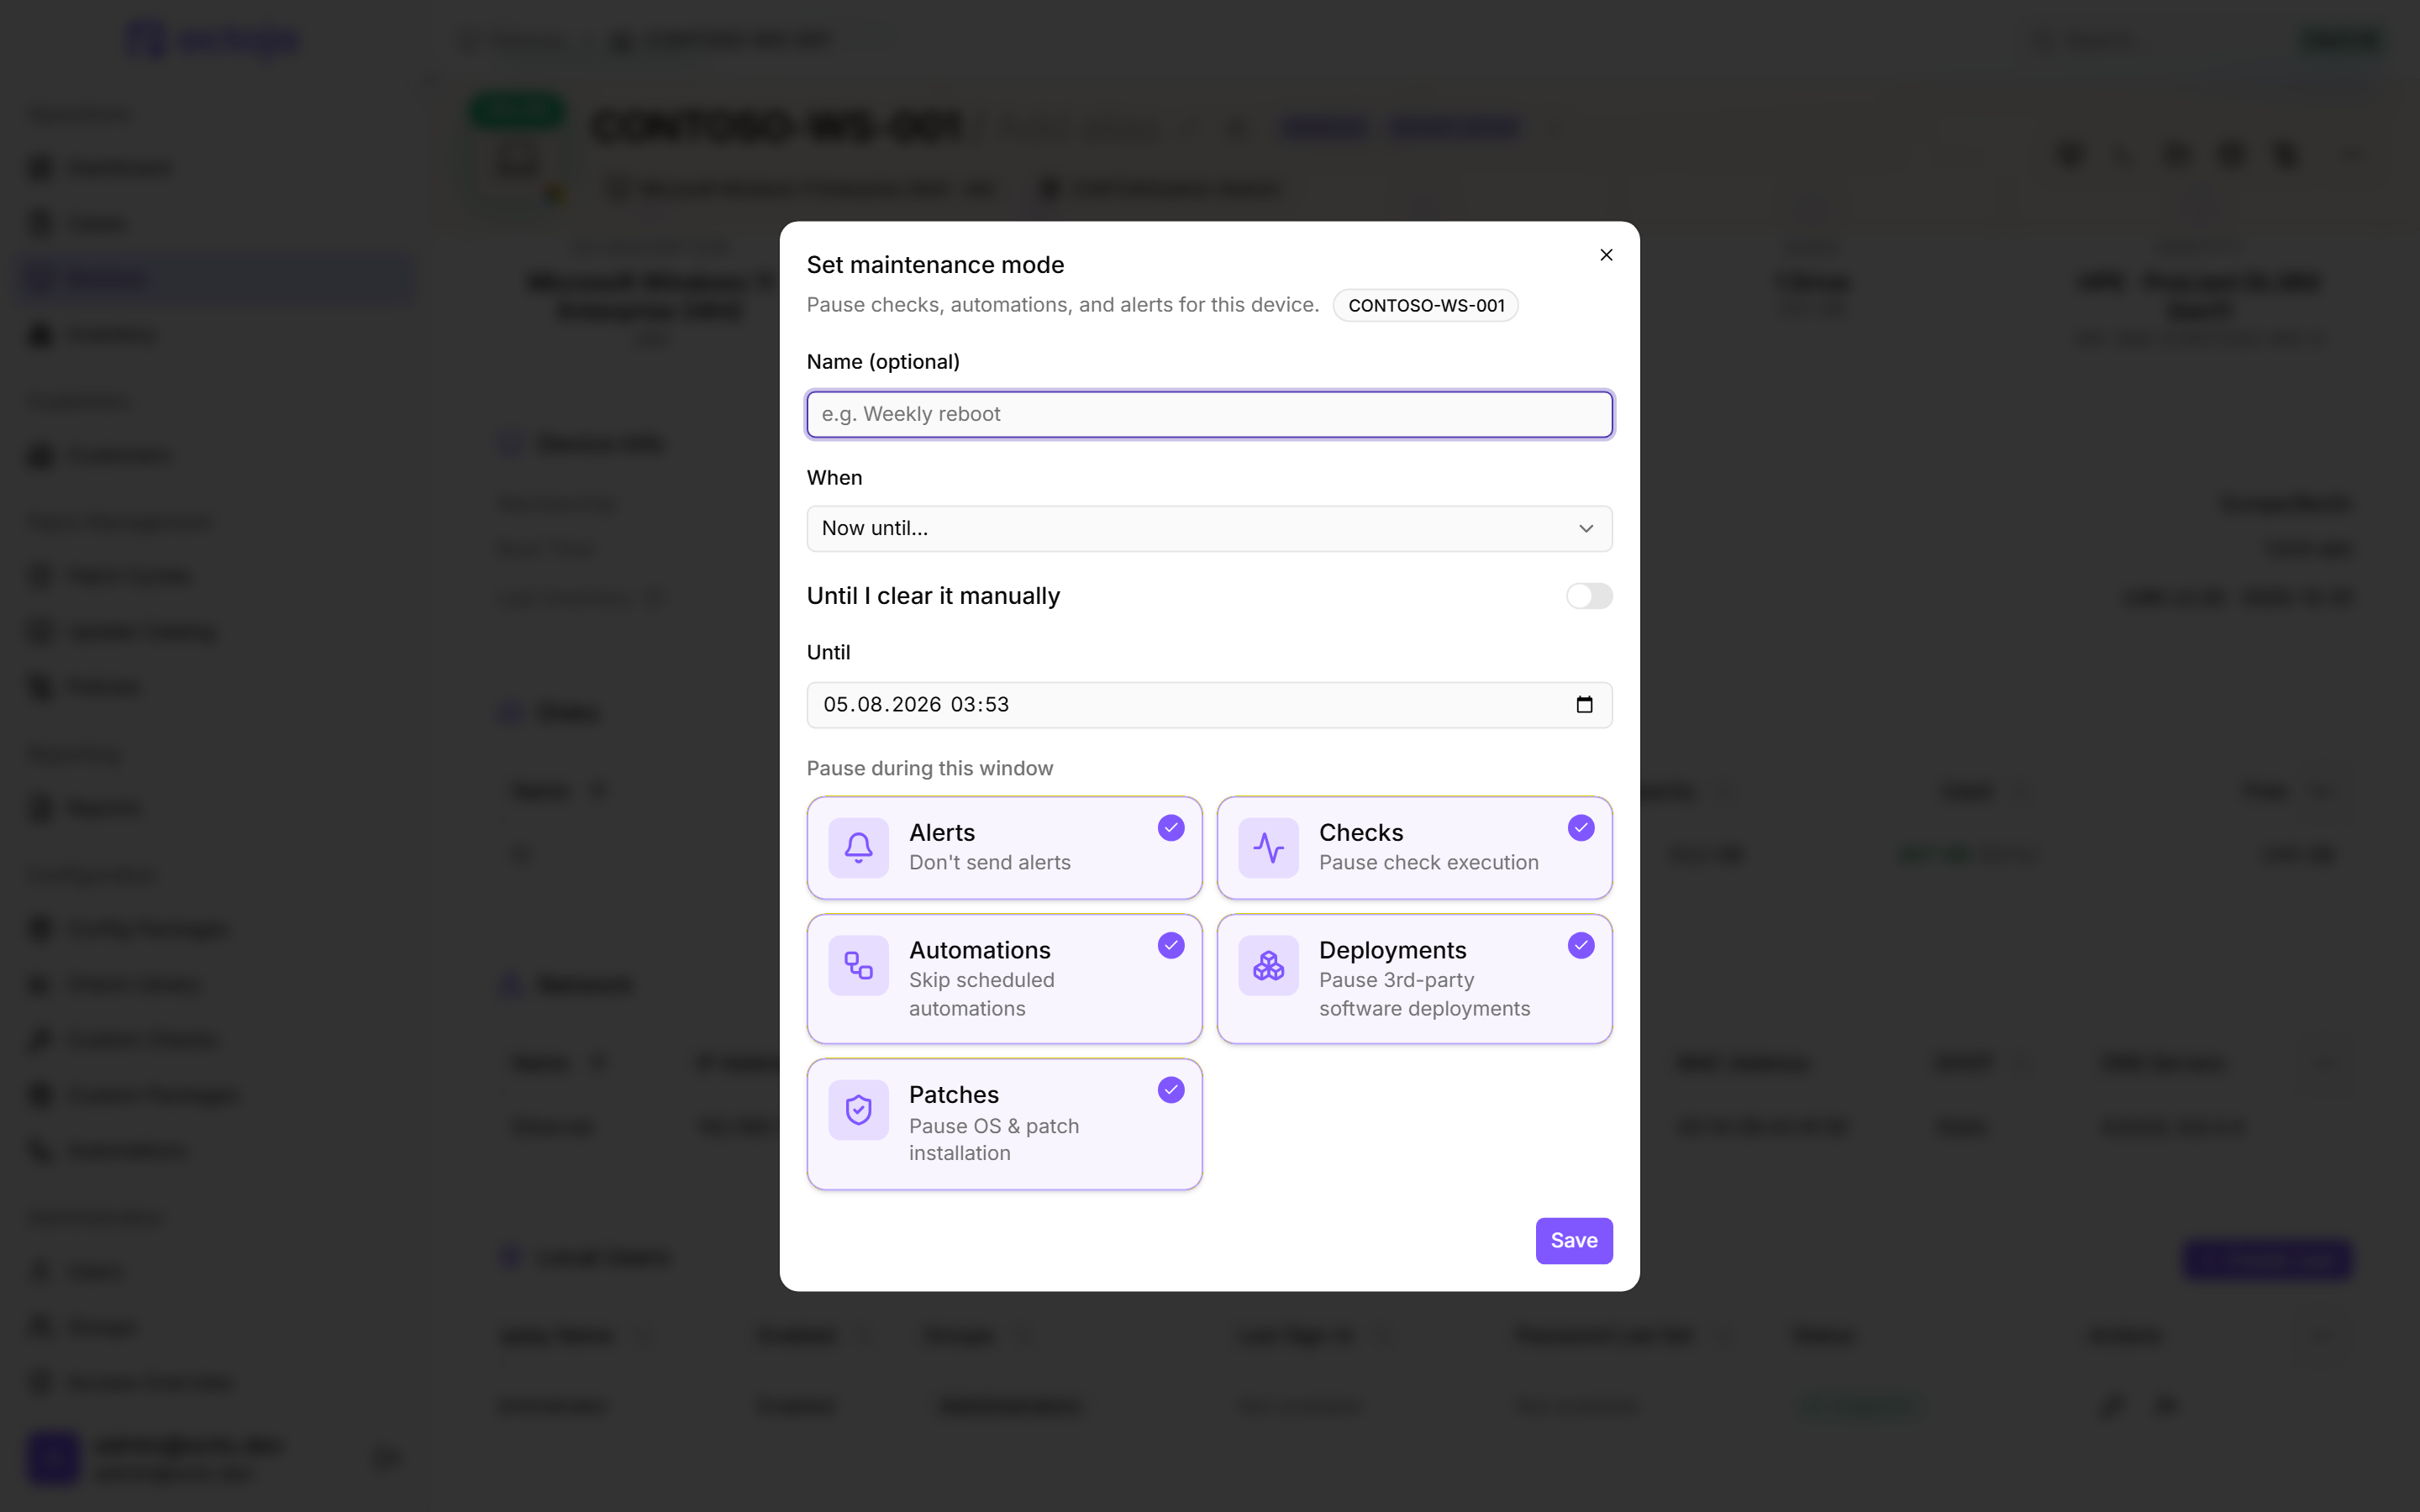
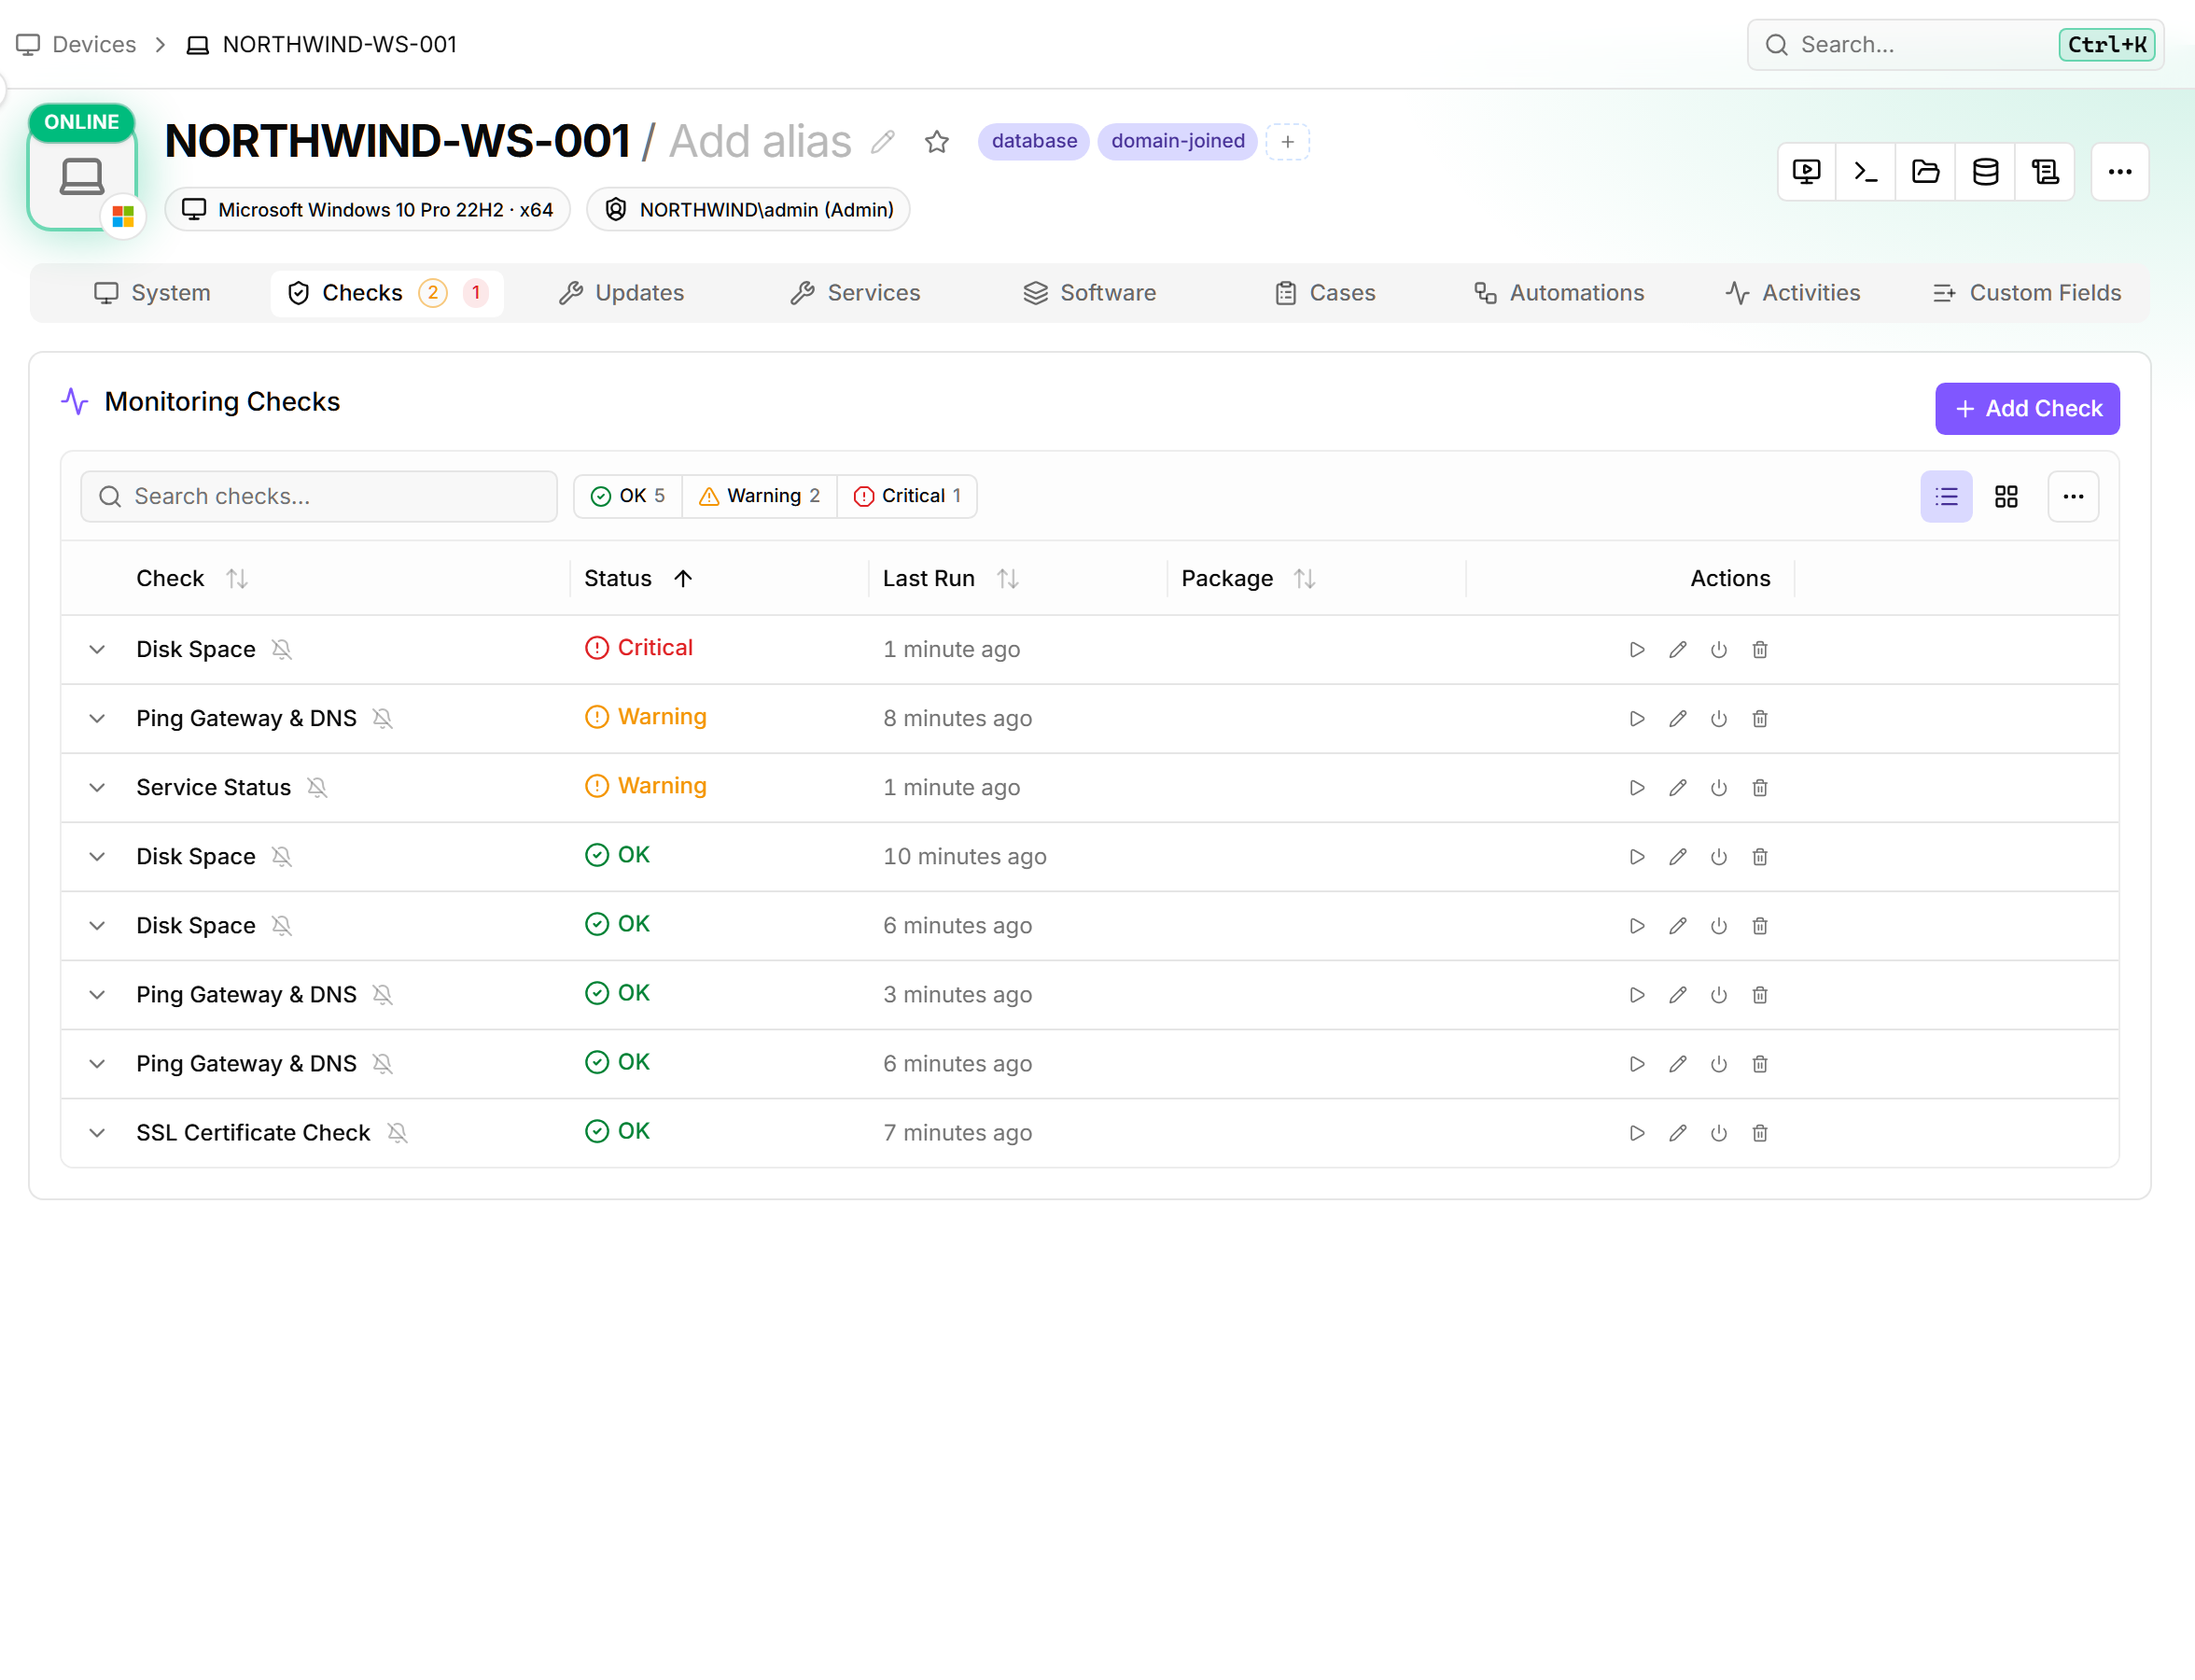

  • Per-check alarm indicator on the checks tab — Every check now shows a filled bell when a package alert configuration applies and a muted bell when none is configured. The “Custom alarm” and “Alarms off” badges still take precedence.
    Per-check alarm indicator on the checks tab

Improved

  • Dialogs stay open on an accidental outside click — Once you've entered or changed something, a click outside the dialog no longer discards it. This applies to every dialog.
  • Choose which Lywand score scope to show — octoja keeps separate All, Managed and Unmanaged scores per customer and device. It remembers your choice, and checks, dashboards and report widgets all follow it.
  • Per-drive thresholds on the disk-space check — Set threshold exceptions per drive, so you no longer have to raise the system drive's thresholds just because a data drive legitimately runs nearly full.
  • File Age check watches the newest file in a folder — Give it a folder and a pattern and it checks the newest matching file — a backup folder whose filenames change, for example. Watching one exact file still works.
  • Reliable clipboard in remote desktop — Copying out of a session no longer fails silently when your browser blocks the clipboard. Recent failures retry on their own, and older ones get a retry button in the toolbar.
  • Resizable Storage Analyzer columns — Resize columns so long nested paths stay readable. Row actions now sit in the name cell, and File Explorer and the Storage Analyzer use the same ones.
  • Event Log check: alert on a missing event, and match message text — The “Expected events (alert when missing)” option warns you when an event you expect never arrives. Its “message contains” matching now reads the text as shown in Event Viewer, umlauts included.
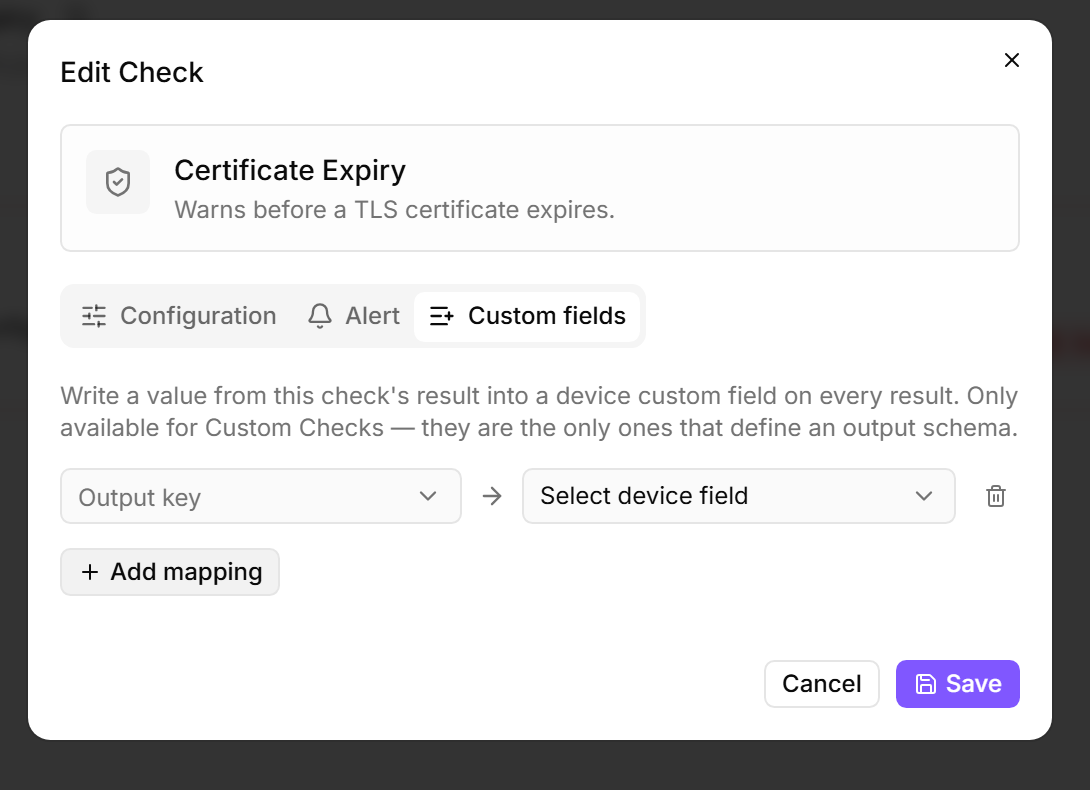
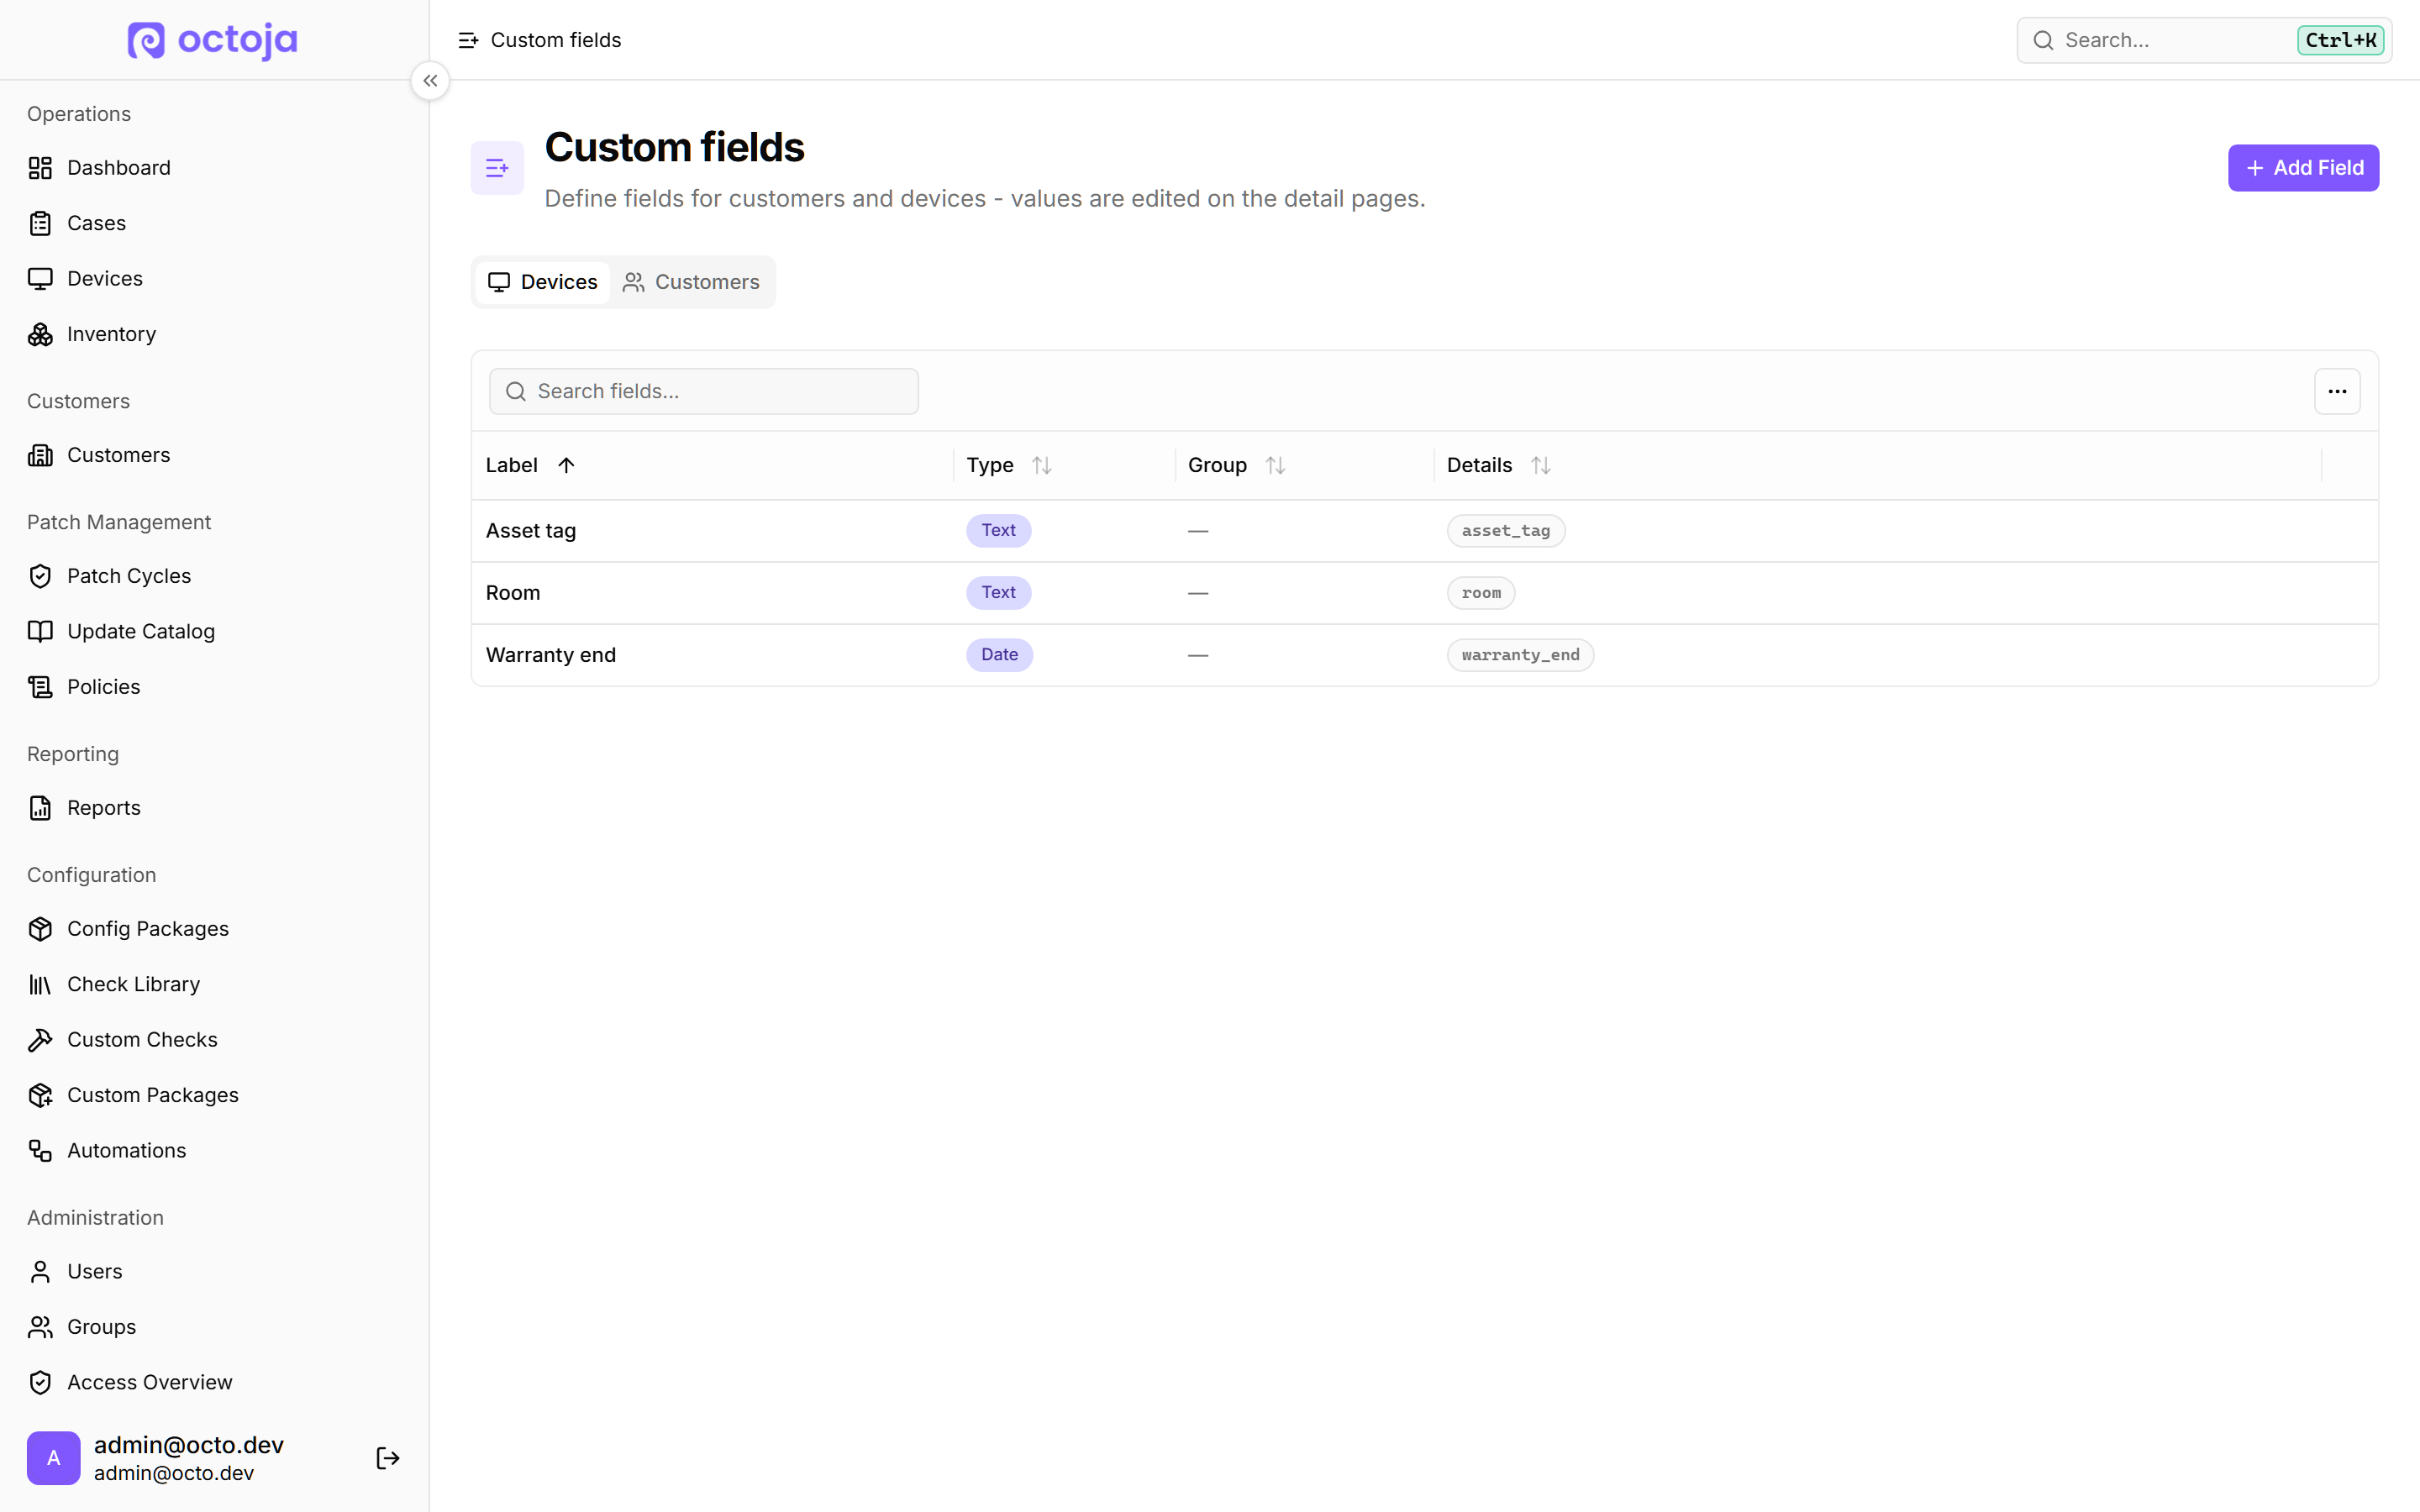

  • Check "Custom fields" tab — The former “Write-back” tab now carries this name, with a tooltip explaining that it maps check-result values into a device's custom fields.
    Check "Custom fields" tab
  • Alarm badge shows the real minimum severity — The badge now shows the minimum severity configured for the channel instead of always saying “failed” — Warning, for example, when the channel fires from Warning.
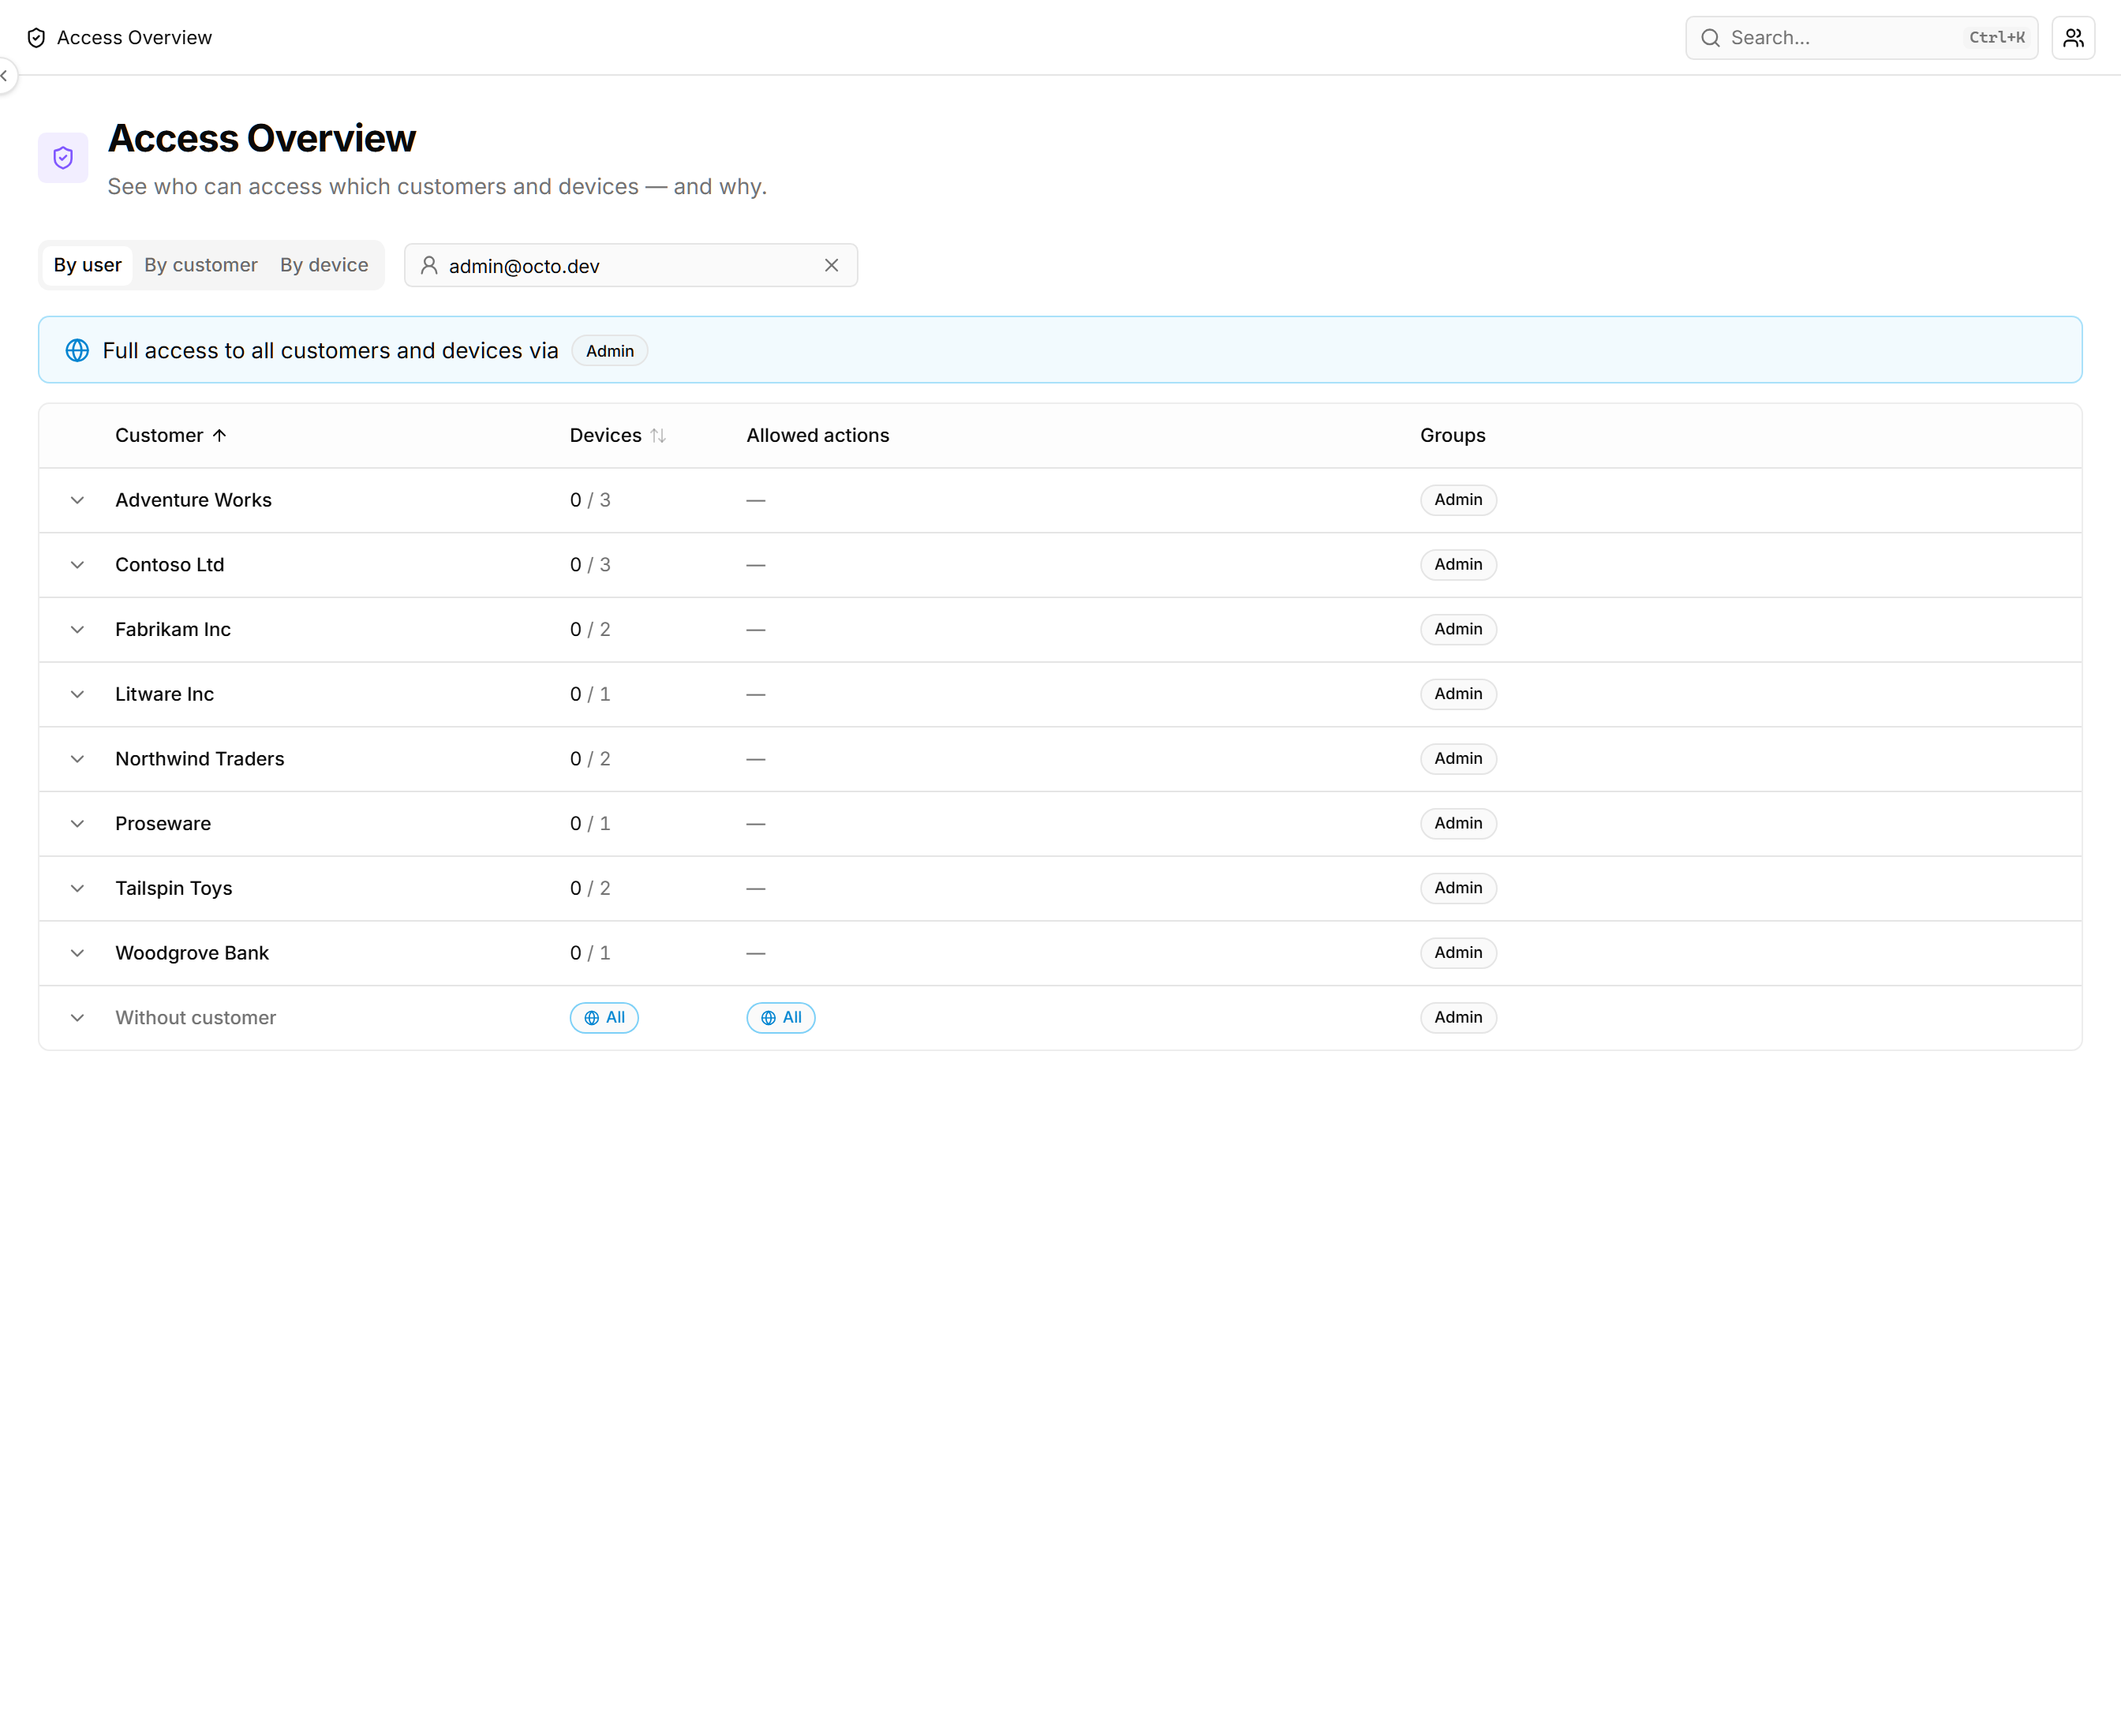
  • Finer-grained permissions across admin surfaces — Changing group membership now needs the group-management permission. You can grant the custom-fields permission in the group editor, and alarm editors can pick alert-channel targets without needing full integration access.
  • Device context on the patch and automation screens — Device names on patch cycles, automation runs, configuration packages and the customer dashboard are now links, and hovering one opens a preview card. The patch-cycle results table also gains a Customer column.
  • Pick the SNMPv3 protocols for an agentless device — “Auth protocol (v3)” offers SHA-1 and SHA-256, “Privacy protocol (v3)” offers AES-128, AES-192 and AES-256. Both can be set to None.
  • The SMART check reads drives it used to skip — On Windows, when a drive's usual self-test data can't be read, the check now falls back to what Windows itself reports about its health.
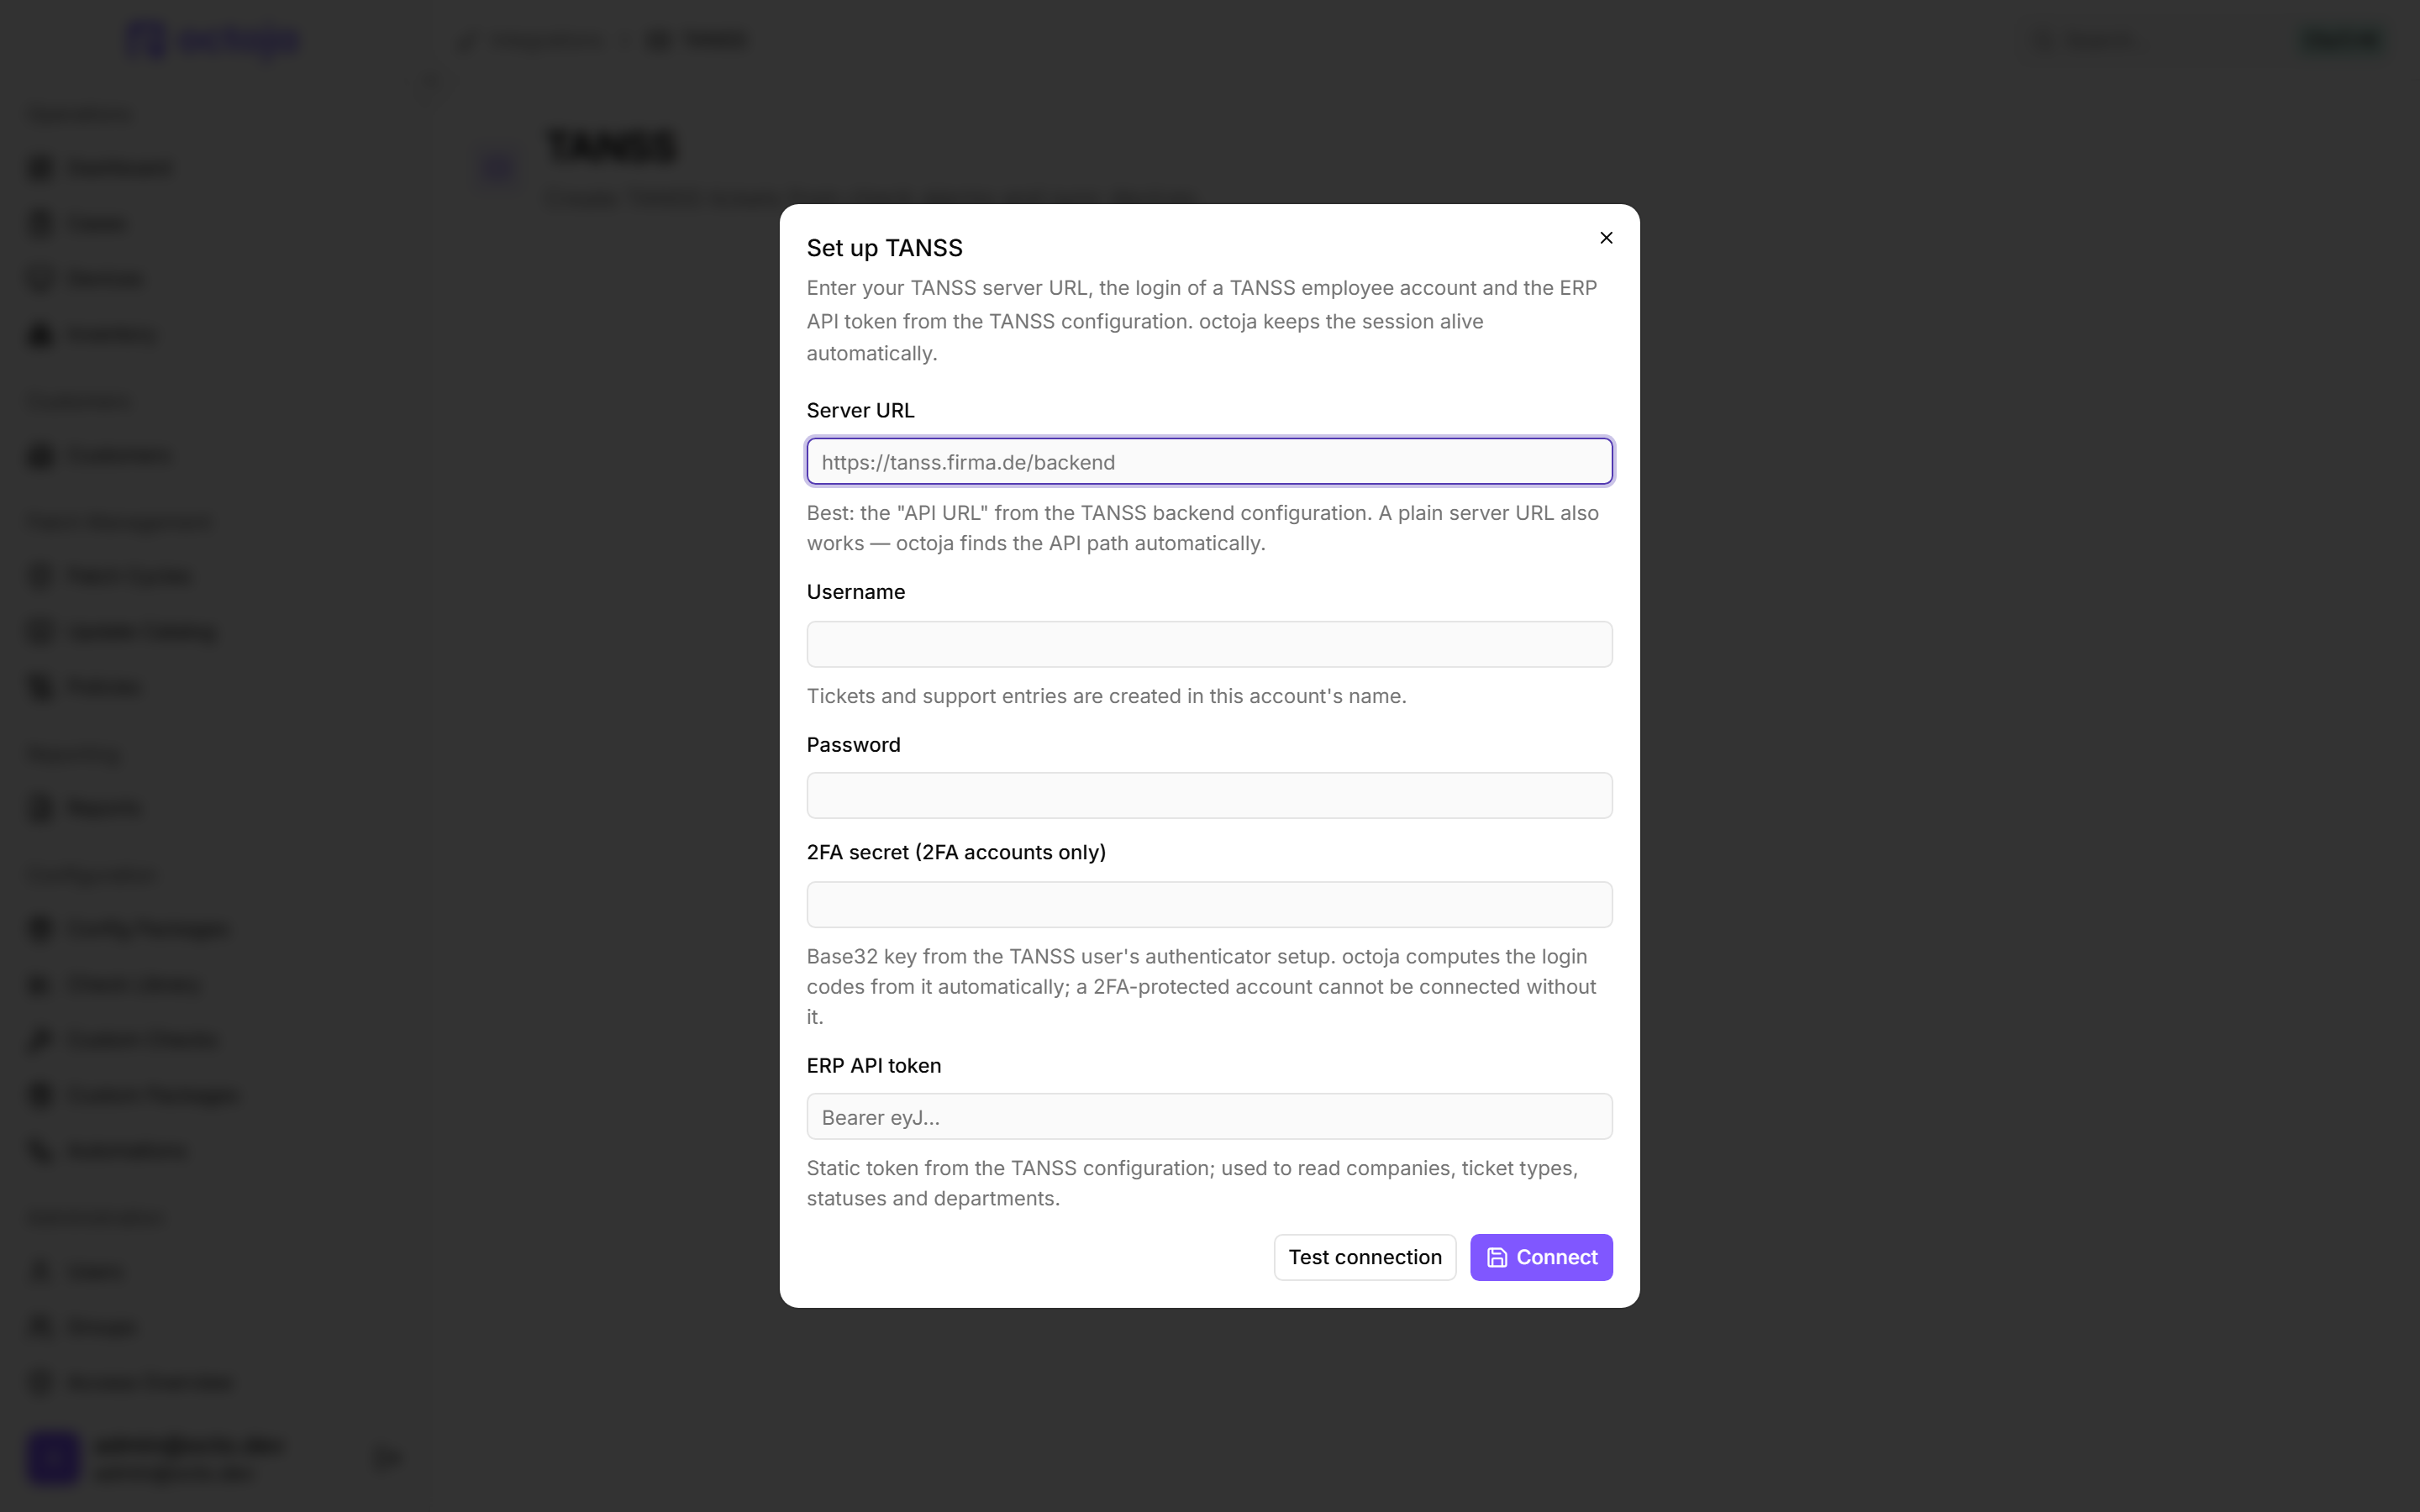
  • TANSS setup finds the server on its own — Enter just the server address and octoja locates the API path itself. The ERP token works with or without a “Bearer” prefix, and the company list fills correctly.
  • Steadier picture in remote desktop on a busy connection — The session now adjusts its frame rate on the device itself rather than in your browser. On a tight connection the picture softens evenly instead of stuttering and catching up in bursts.

Fixed

  • Blocking the Windows Update page now works — The block coexists with a Windows policy the customer already applies, and octoja withdraws it again once the patch policy no longer applies.
  • Custom SNMP checks work on Windows
  • SNMP check no longer reports a false offline — A device that returns an empty description no longer counts as offline.
  • Network Interface check runs on Linux — The check also no longer drops Linux adapters and VLAN sub-interfaces that share a hardware address or have none at all.
  • Service rule suggestions show the right value — Suggestions now display the service's display name while saving its internal name, so the rule matches.
  • Windows agent updates no longer restart the old version
  • PowerShell automations report the right result — A leftover exit code from an earlier command no longer fails the run, and octoja now captures values you assign inside functions as outputs.
  • Package-manager list refreshes when you switch — Switching between Chocolatey and winget in a device's “Software” tab now refreshes the list and badge each time.
  • Agentless check changes take effect immediately — A per-device check setting on an agentless device, a PDU for example, now applies right away instead of only being stored.
  • Local-admins quick command works in every language
  • Dashboard filter column scrolls as one
  • Dashboard pagination stays at the bottom while searching
  • Tag-rules page opens on large fleets — The page no longer counts matching devices for every rule up front; you still see the count on each individual rule.
  • Resolving a vulnerability no longer installs unrelated software — “Resolve” on a Lywand finding could match the wrong product and install software nobody asked for. It now only ever updates software already on the device, and warns you when nothing matches.
  • You only see the enrollment tokens for your customers — If you're limited to certain customers, octoja shows and manages only their tokens. Tokens that cover all customers stay with accounts that can reach all of them.
  • Firewall check reads non-English systems — The “Firewall Status” check now understands a German-language system that reports its status as “Aktiv”.
  • A Network Interface check that watches nothing now says so — When its filters excluded every adapter on a device, the check reported OK while monitoring nothing. It now warns, and records which filter step removed them.
  • The “Network Firewall (Appliance)” check reads FortiGate firmware and licence details correctly
  • Scripts no longer lose their output — A script that left a background process running came back with its output cut short. Script automations, software deployments and check runs now capture all of it.
  • Continuous deployment no longer looks scheduled — A configuration package that keeps software continuously up to date now shows “No schedule set” instead of a Deployment schedule it never used.
  • Live-updating lists no longer jump back to page one — When a list refreshes in the background, you stay on the page you're reading as long as nothing about the data has changed.
  • BitLocker details stay open while you read them

July 21st, 2026

New

Improved

Fixed

Highlights

octoja’s biggest release yet: 112 updates — two-thirds more than our previous record. It shapes octoja around how you work — custom fields that flow through checks, automations and rules, automatic patch approval, SMS and phone-call alarms, Active Directory on domain controllers, light/dark white-label branding, and a new Freshservice integration, plus a 2–3× faster dashboard and a long tail of check and patch fixes.

New

  • Custom fields for devices and customers — Define your own fields in seven types, fill them in on the device or customer page, and manage them under "Administration" > "Custom fields".
    Custom fields for devices and customers
  • Checks, automations and rules can use your custom fields — Checks read and write a device's custom field, automations use them as variables and can set or clear one, and the rule builder gains a "Custom Field" condition.
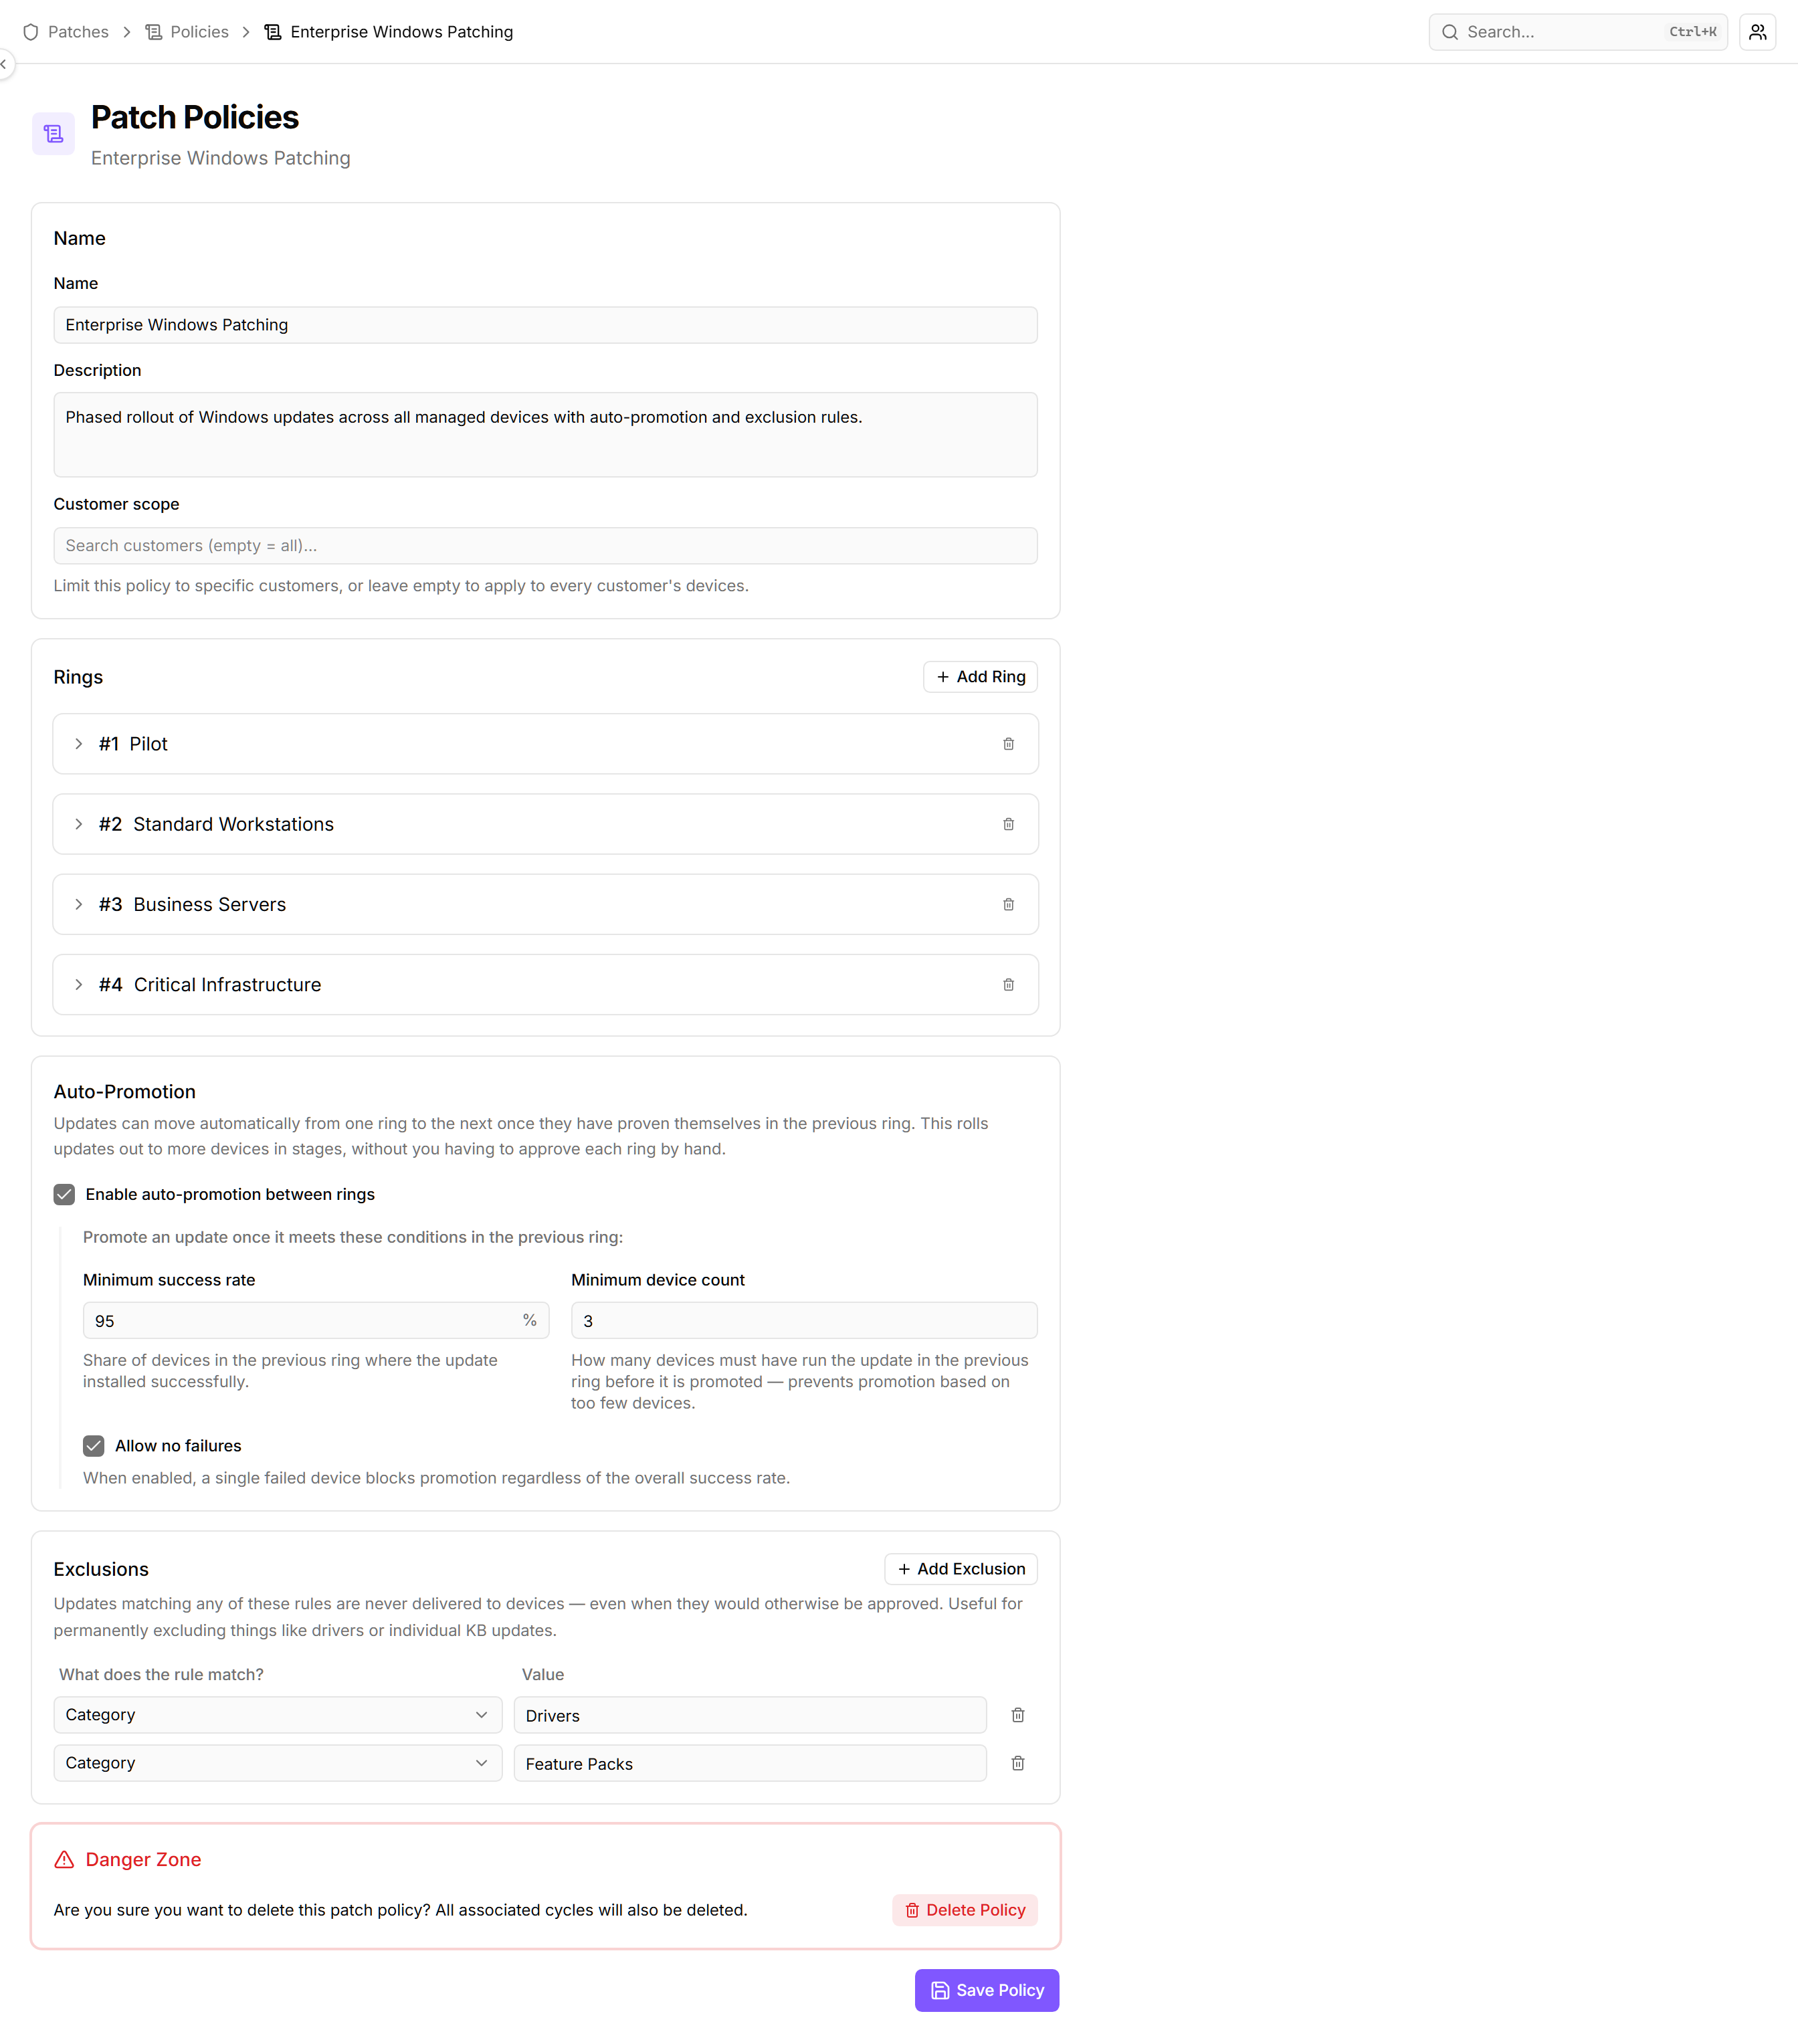
  • Approve patches automatically by rule — Set "Approval mode" to "Automatic approval" and add rules on "Severity", "Category" or "Title" to approve matching updates for the next maintenance window and defer the rest; a rule can also hold an update back until it is a set number of days old.
    Approve patches automatically by rule
  • Hold back Windows updates with a known Microsoft issue — A separate "Exclude updates with known problems" switch withholds any update flagged with an unresolved Microsoft known issue or a red or yellow community warning, until that flag is lifted.
  • Alarms by SMS and phone call — Alarms now reach your team by SMS or phone call alongside the mobile app, via a group under "Integrations" > "Mobile notifications"; 500 SMS and 500 calls per month are included. Each group sets one language for all its SMS, call and app texts, and a new "History" tab shows which notifications were sent.
  • Freshservice ticket integration — Connect Freshservice under "Integrations" and match your customers, and the new "Freshservice ticket" alert channel opens a ticket for every alarm and closes it on recovery.
  • Device sync to the Freshservice inventory — Turn on "Sync devices to Freshservice hourly", or use "Sync now", to push your matched customers’ devices into Freshservice’s asset inventory. Works only on Freshservice accounts created after 31 March 2026.

  • Invite users by email — "Invite User" emails an invitation; the recipient sets a password or uses your identity provider, and user management splits into "Users" and "Invitations" tabs where pending invites can be resent or revoked.
    Invite users by email
  • Active Directory management on domain controllers — Domain controllers gain an "Active Directory" tab listing the users, computers and groups from the domain, where you create, disable or delete accounts and reset passwords without a remote session.
  • Prevent local uninstall of the octoja agent on Windows — "Prevent local uninstall" hides the octoja agent from the Windows program list so everyday users can't remove it. Set it per device or through a configuration package — a deterrent rather than a hard block.
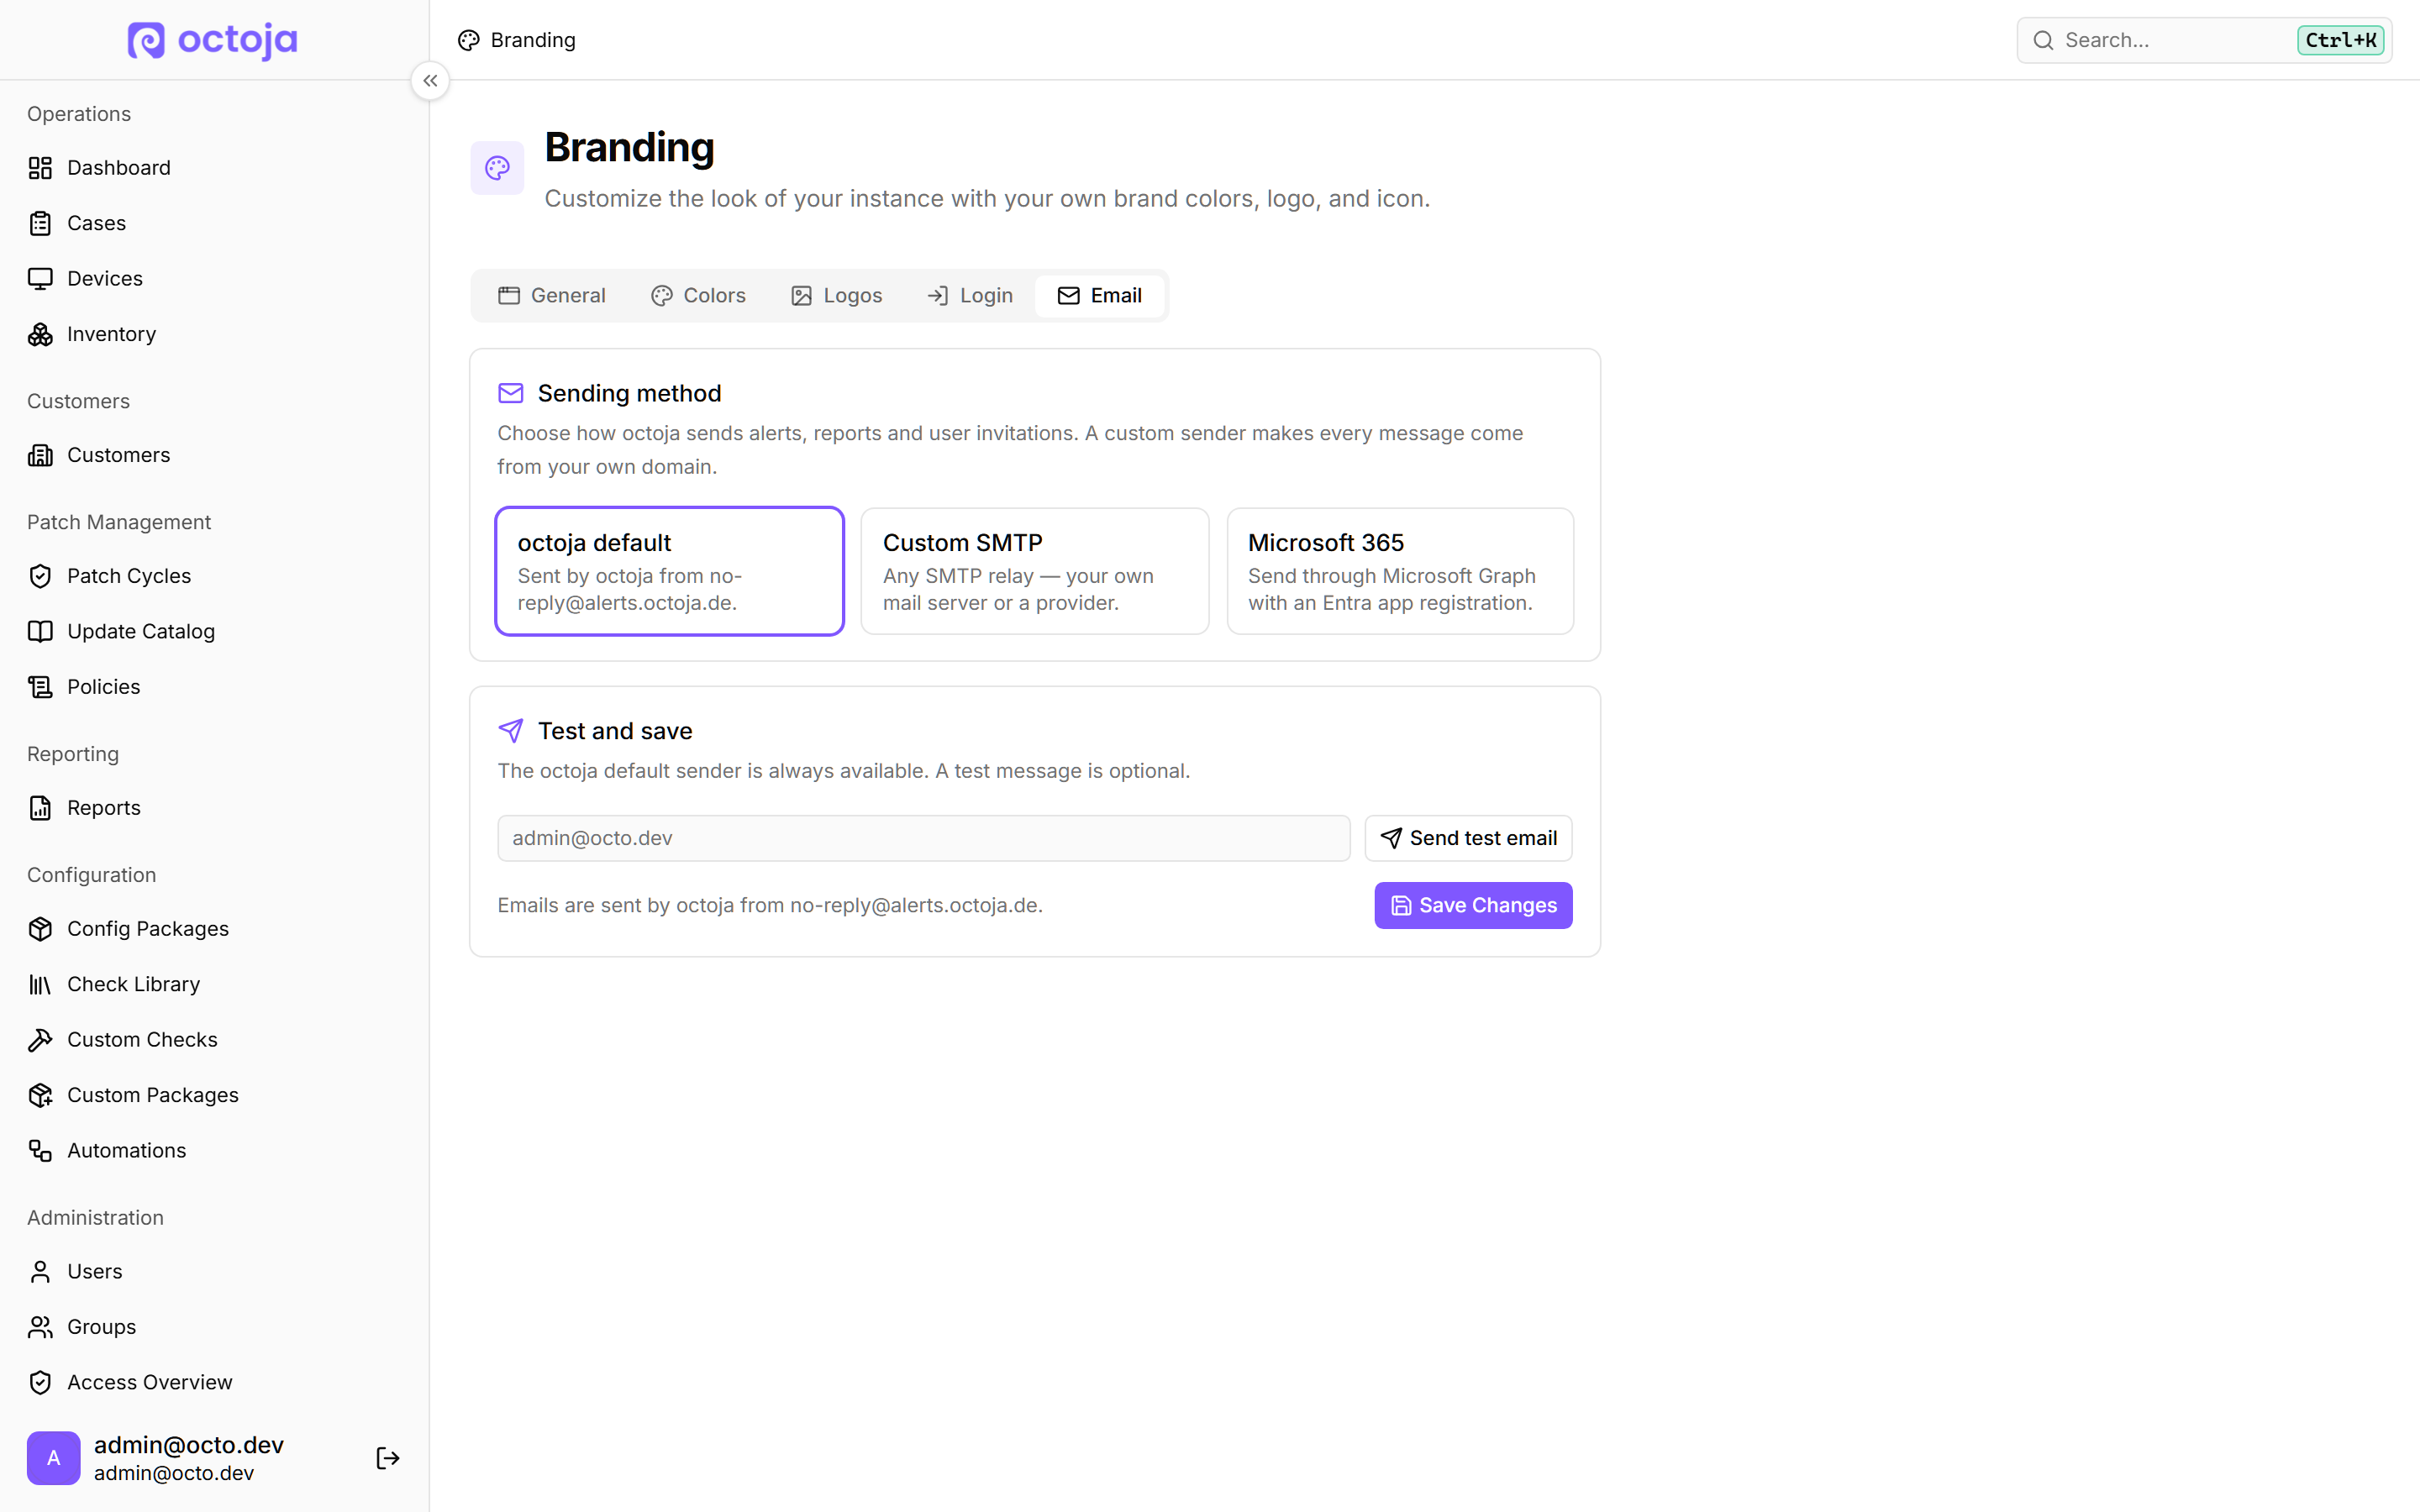

  • Light and dark white-label branding — Branding now carries a separate logo, icon, brand colour and secondary colour for light and dark mode, in paired "Light mode" / "Dark mode" fields on the "Branding" page.
    Light and dark white-label branding
  • New Network Shares check lists every SMB share and its permissions — Lists every SMB share on a Windows device with its share and NTFS permissions, flagging any open to Everyone, Authenticated Users, Anonymous or Guests.
  • New OS End of Life check for Windows, macOS and Linux — Detects the installed Windows, macOS or Linux release and shows its active-support and end-of-life dates from the endoflife.date catalog.
  • More Windows and Office inventory on the device page — The "System" tab of a Windows device gains "License Keys", "Network Shares" and "Mapped Network Drives" tables, "Roles & Features" on Windows Server, and an "OS build" row.
  • Scope new automations and cases to a customer — A new "Customer" field in the "New Automation" and "Create Case" dialogs: limited accounts must set it, full-access accounts can leave it blank to run across every device.
  • New CyberPower UPS, ATS and PDU check over SNMP — Reports battery status, load, remaining runtime, voltages, redundant supplies and transfer-switch state against your own thresholds.
  • New Wortmann Warranty check reads the TERRA service portal — Looks a Windows device up in the Wortmann/TERRA service portal by serial number and reports its warranty period, remaining days and booked service.
  • New DNS Blacklist (RBL) check watches mail-server reputation — Checks the IPv4 addresses you specify against DNS blocklists (Spamhaus, SpamCop, Barracuda by default) and alerts when one is listed.
  • New Volume Shadow Copy Age check for Windows volumes — Reports how old the newest shadow copy is on each Windows volume that has one — an early warning for backups and Previous Versions that have quietly stopped working.
  • vCenter check reads ESXi host hardware temperature sensors — It now judges every temperature sensor against the ESXi host's own firmware health.
  • Open a past check result from the History view — Click a point on the history chart or a row in "History" to reopen that run's full result details instead of just its time and status; 51 more checks now carry that per-run detail.
    Open a past check result from the History view
  • Ignore a single Lywand vulnerability from the device page — It stops counting toward the device's score but stays listed as "Ignored", and you can un-ignore it later.
  • A Managed Lywand Score card on the customer dashboard — Customers with a Lywand assessment get a "Managed Lywand Score" card first — an A–F grade covering only the findings on products in your Lywand service package.
  • Zip and extract files in the remote file explorer
  • Wake an offline device — Choose "Wake device" and octoja sends a Wake-on-LAN packet from another online device sharing the target's subnet, or name the sender via "Wake using a specific relay". A gateway monitored over TR-064 also offers "Send Wake-on-LAN" for the inactive clients in its "Connected clients" table.
  • Reuse an existing enrollment token when setting up deployment — The deployment configuration dialog gains a "Use existing" tab alongside "Create new".
  • New Lightning Radar check warns about nearby lightning strikes — Enter an address or coordinates, or switch on "Use device location"; the result view plots the nearest strikes, names the closest one's distance and direction, and shows a thunder countdown to when its thunder would be heard.
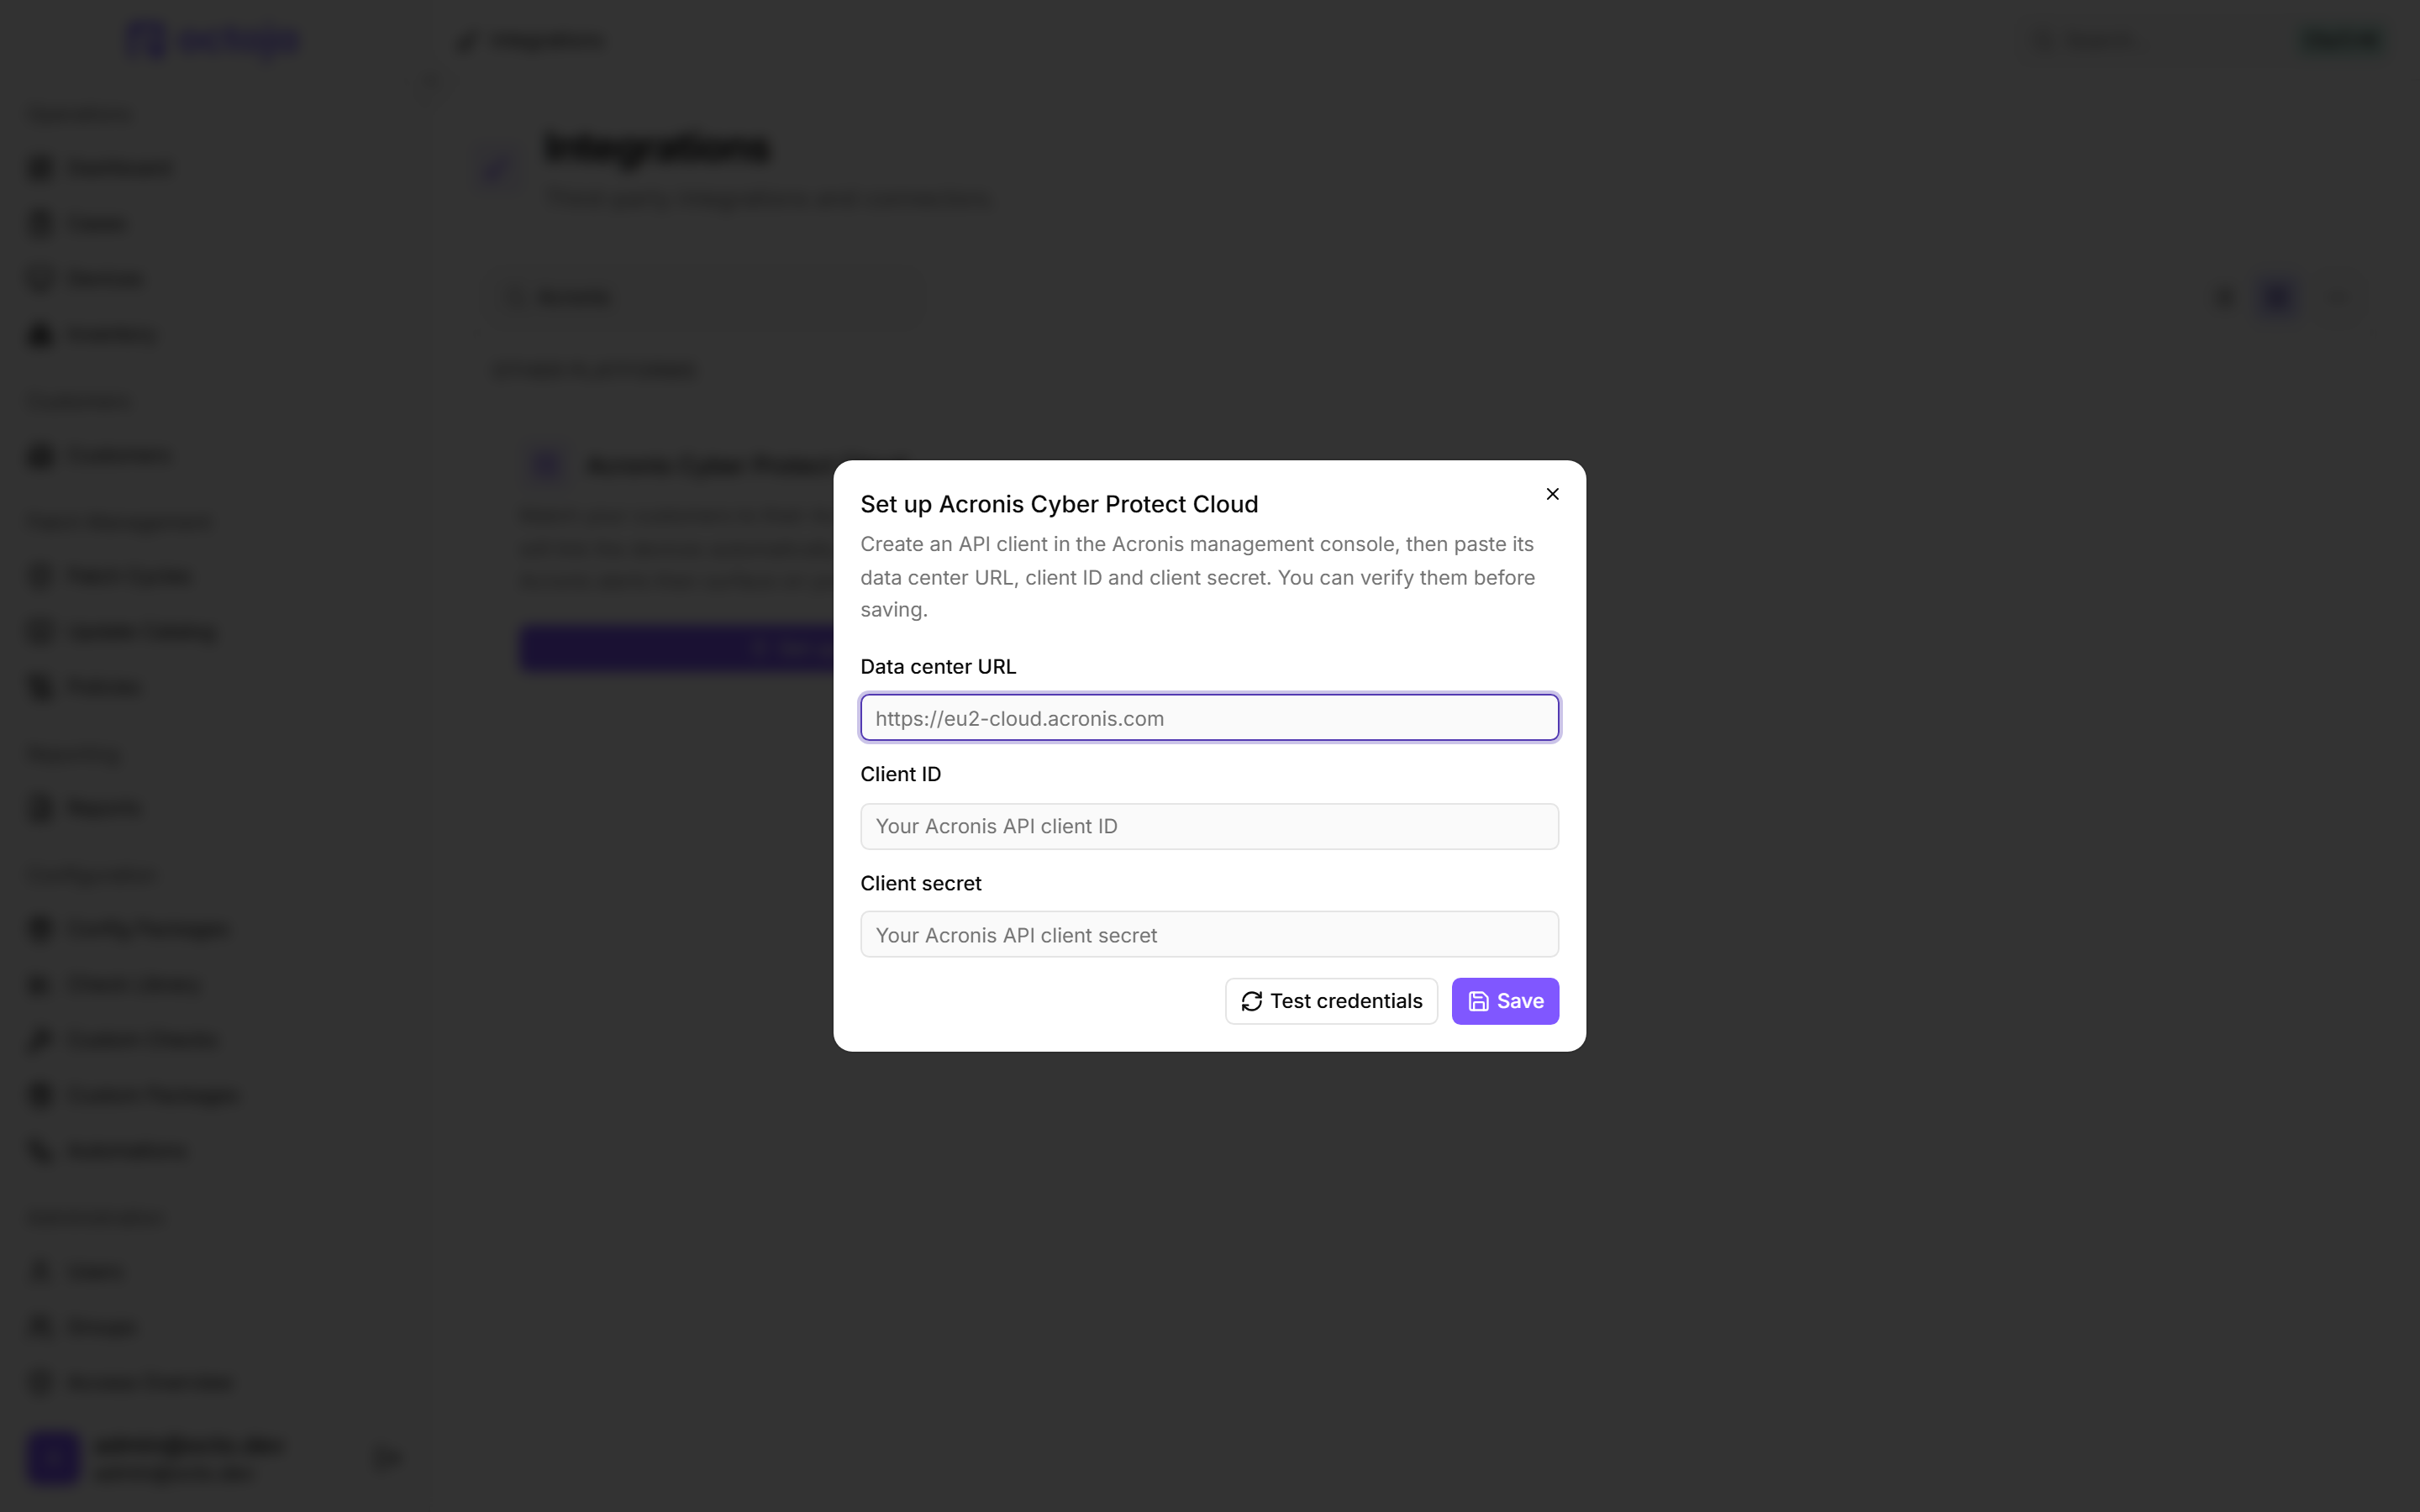
  • Connect DocBee with an access token instead of a username and password — The integration then runs on a token rather than a stored account password.
  • Save your display language to your profile — octoja then applies your choice wherever you sign in, not just in the browser where you picked it.

Improved


  • Faster dashboard — The dashboard opens roughly two to three times faster and stays responsive as you scroll long device lists.
    Faster dashboard

  • Group permissions now use access levels — Group permissions moved to their own "Permissions" tab, where each row has a single access-level picker — "No access", "Read" or "Read & write" — instead of a long checkbox list.
    Group permissions now use access levels
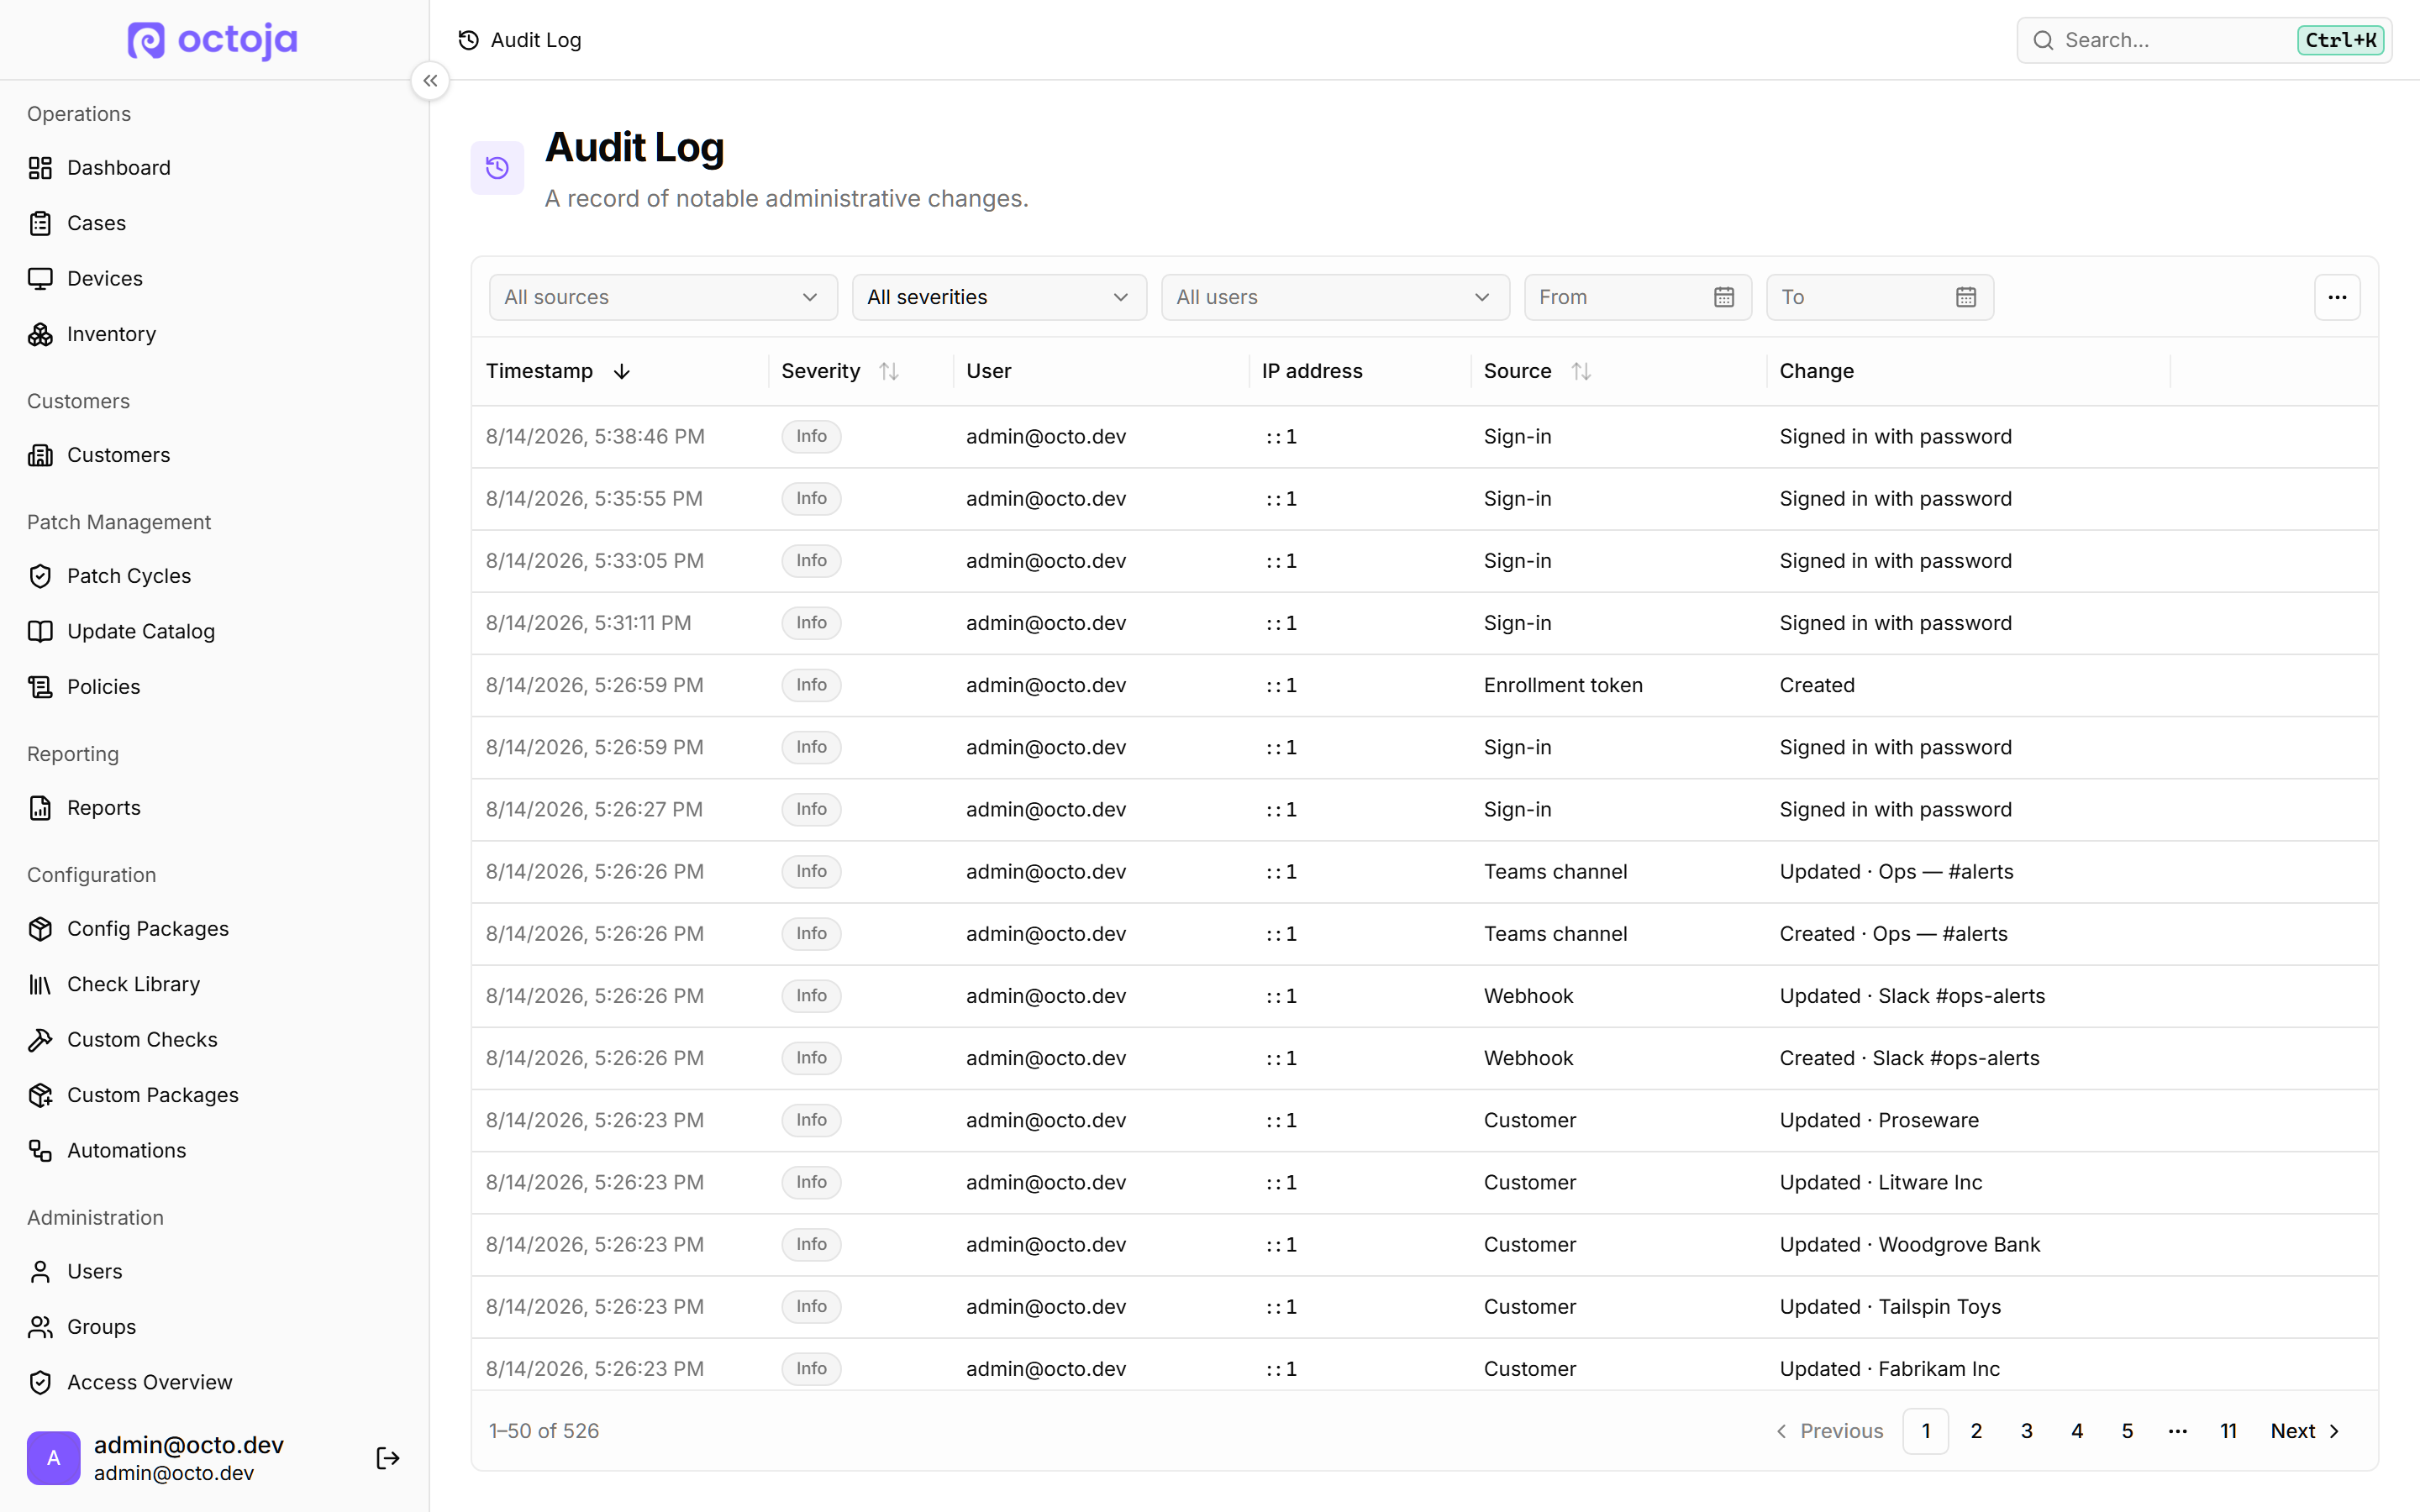
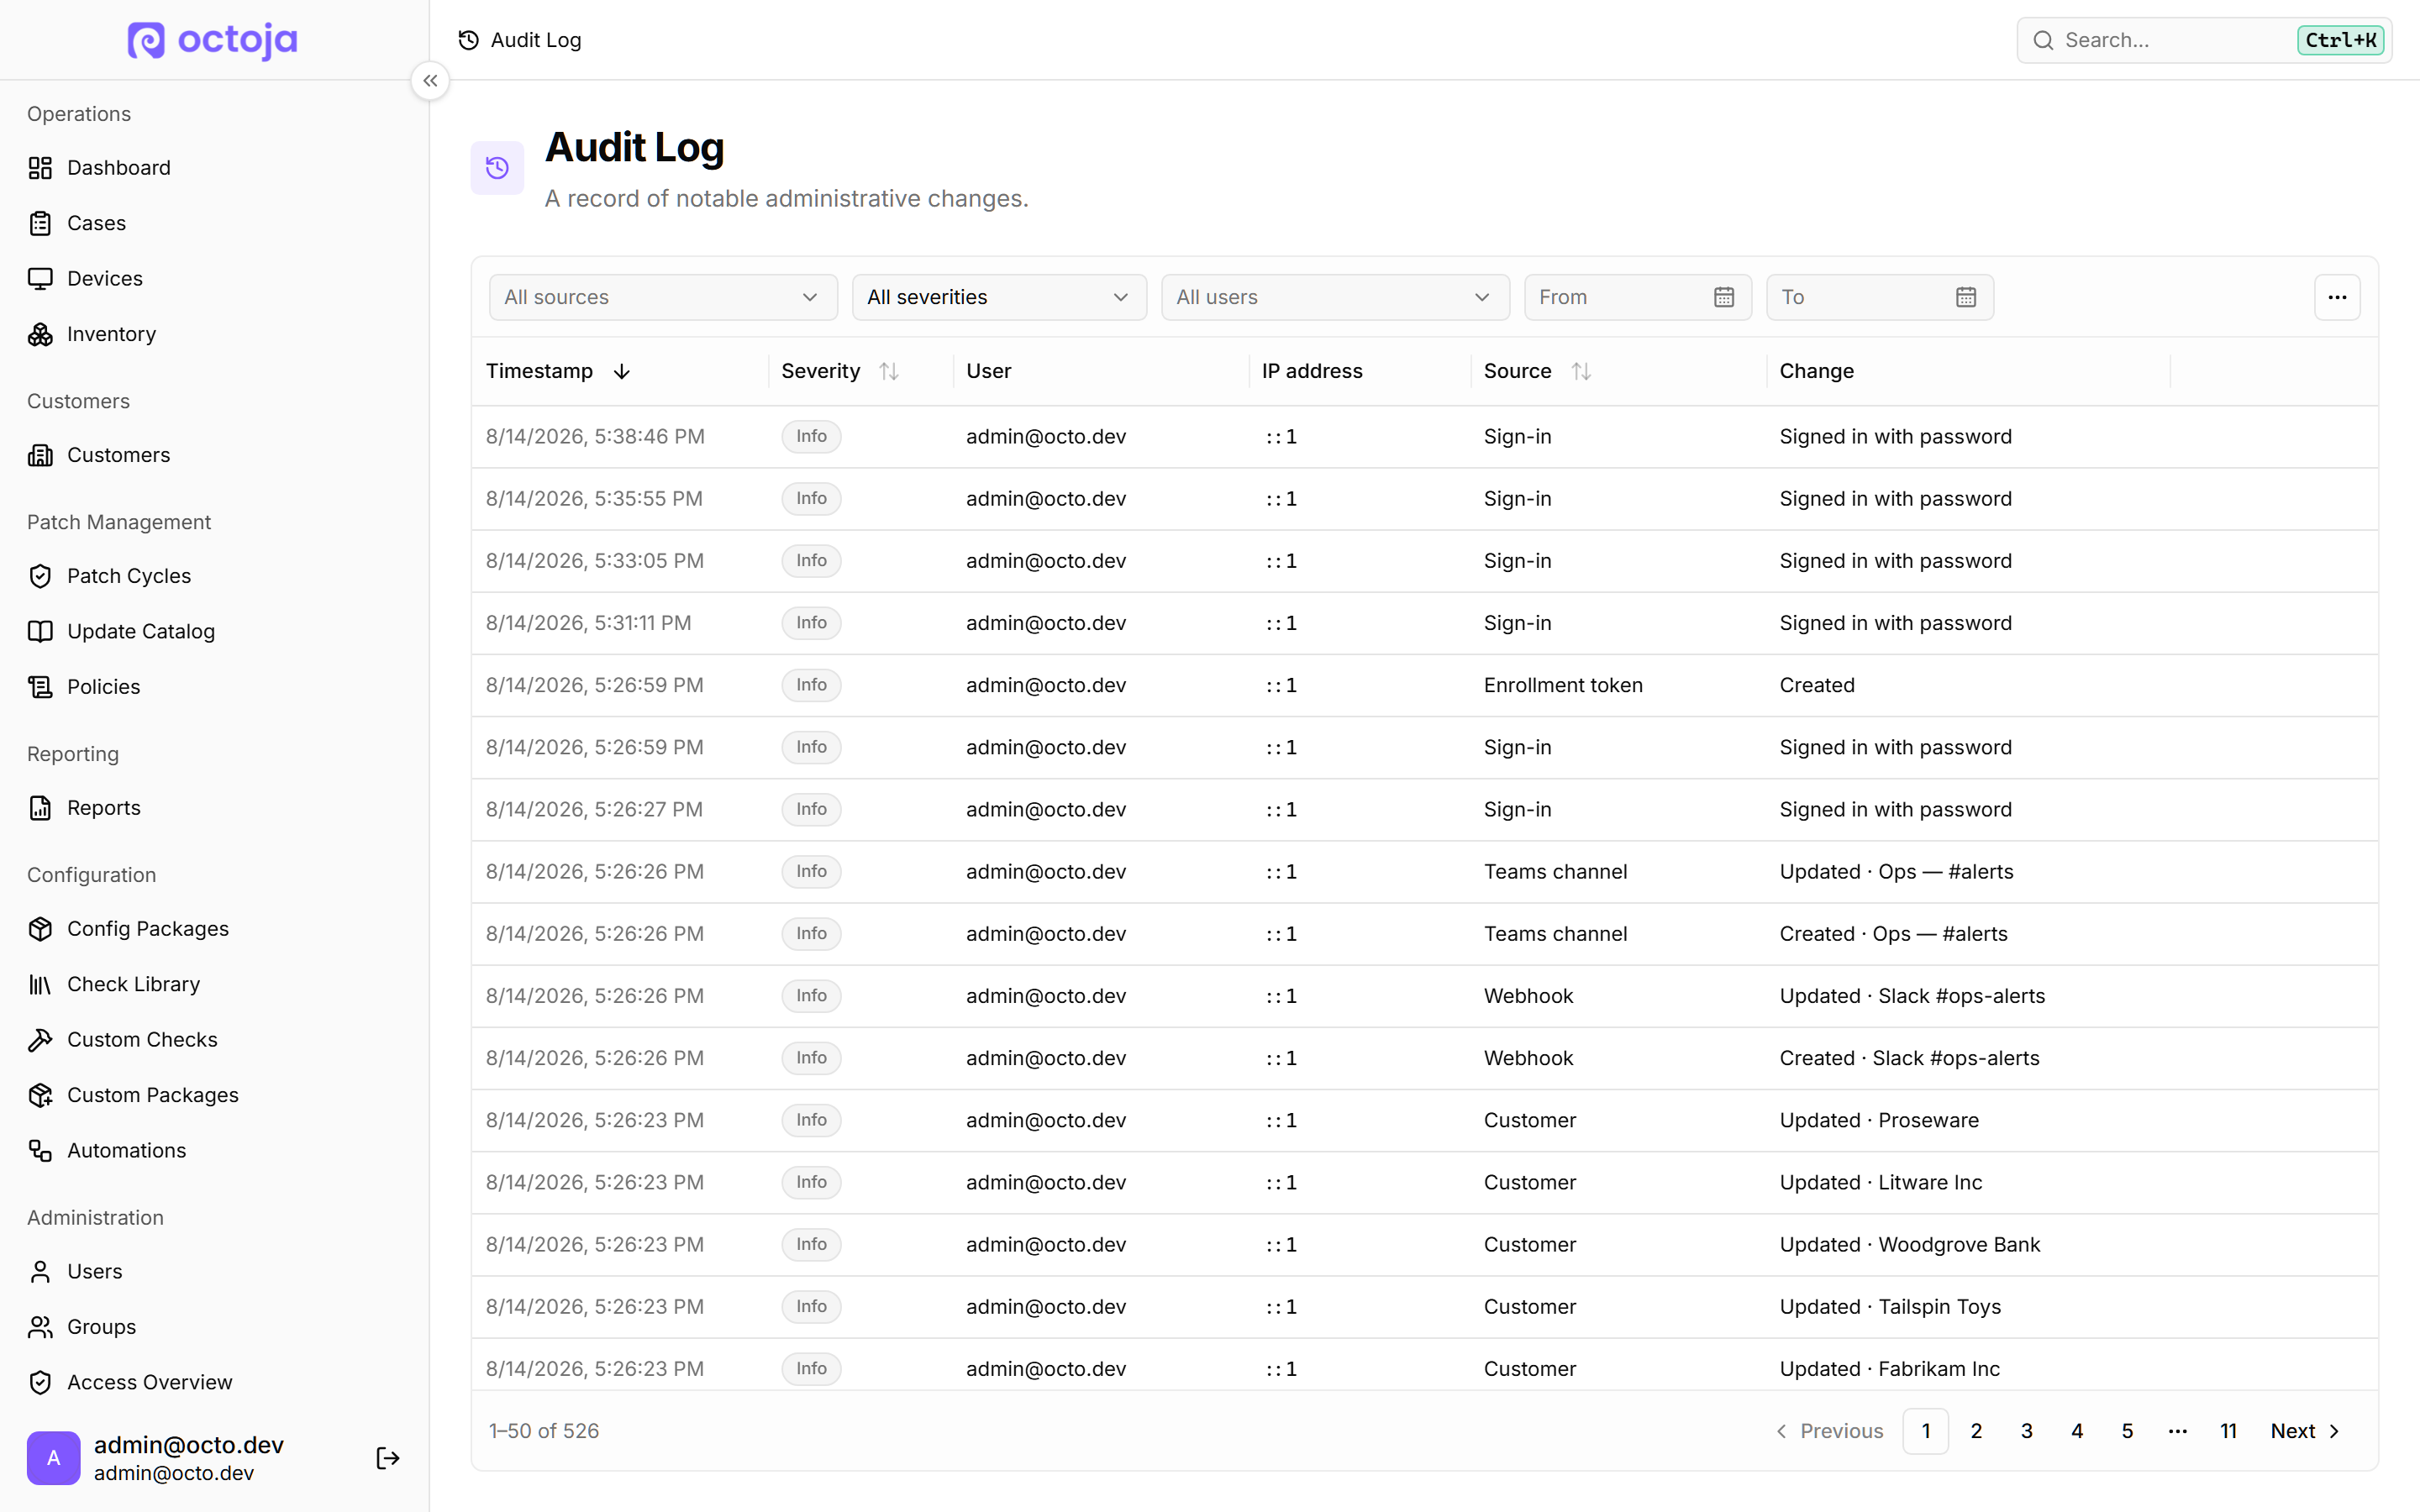
  • Audit Log now records more than 85 administrative actions — Integrations, webhooks, enrollment tokens, alert configurations, patch cycles and more are now covered, and edits name the field that was touched.
  • Per-device Asset Logs record remote actions and check changes — A device's "Asset Logs" now capture ad-hoc script runs, test package deployments and opening the "Web Console".
  • Lywand vulnerabilities split into managed and unmanaged — A new "General view / Managed / Unmanaged" filter separates findings on products you cover (managed) from those outside your support scope (unmanaged); the "Managed Lywand Score" counts only the managed ones.

  • Patch policies: optional deployment rings and hourly maintenance windows — Turn off "Use deployment rings" to patch every covered device together in a single maintenance window, and windows can now repeat as often as hourly.
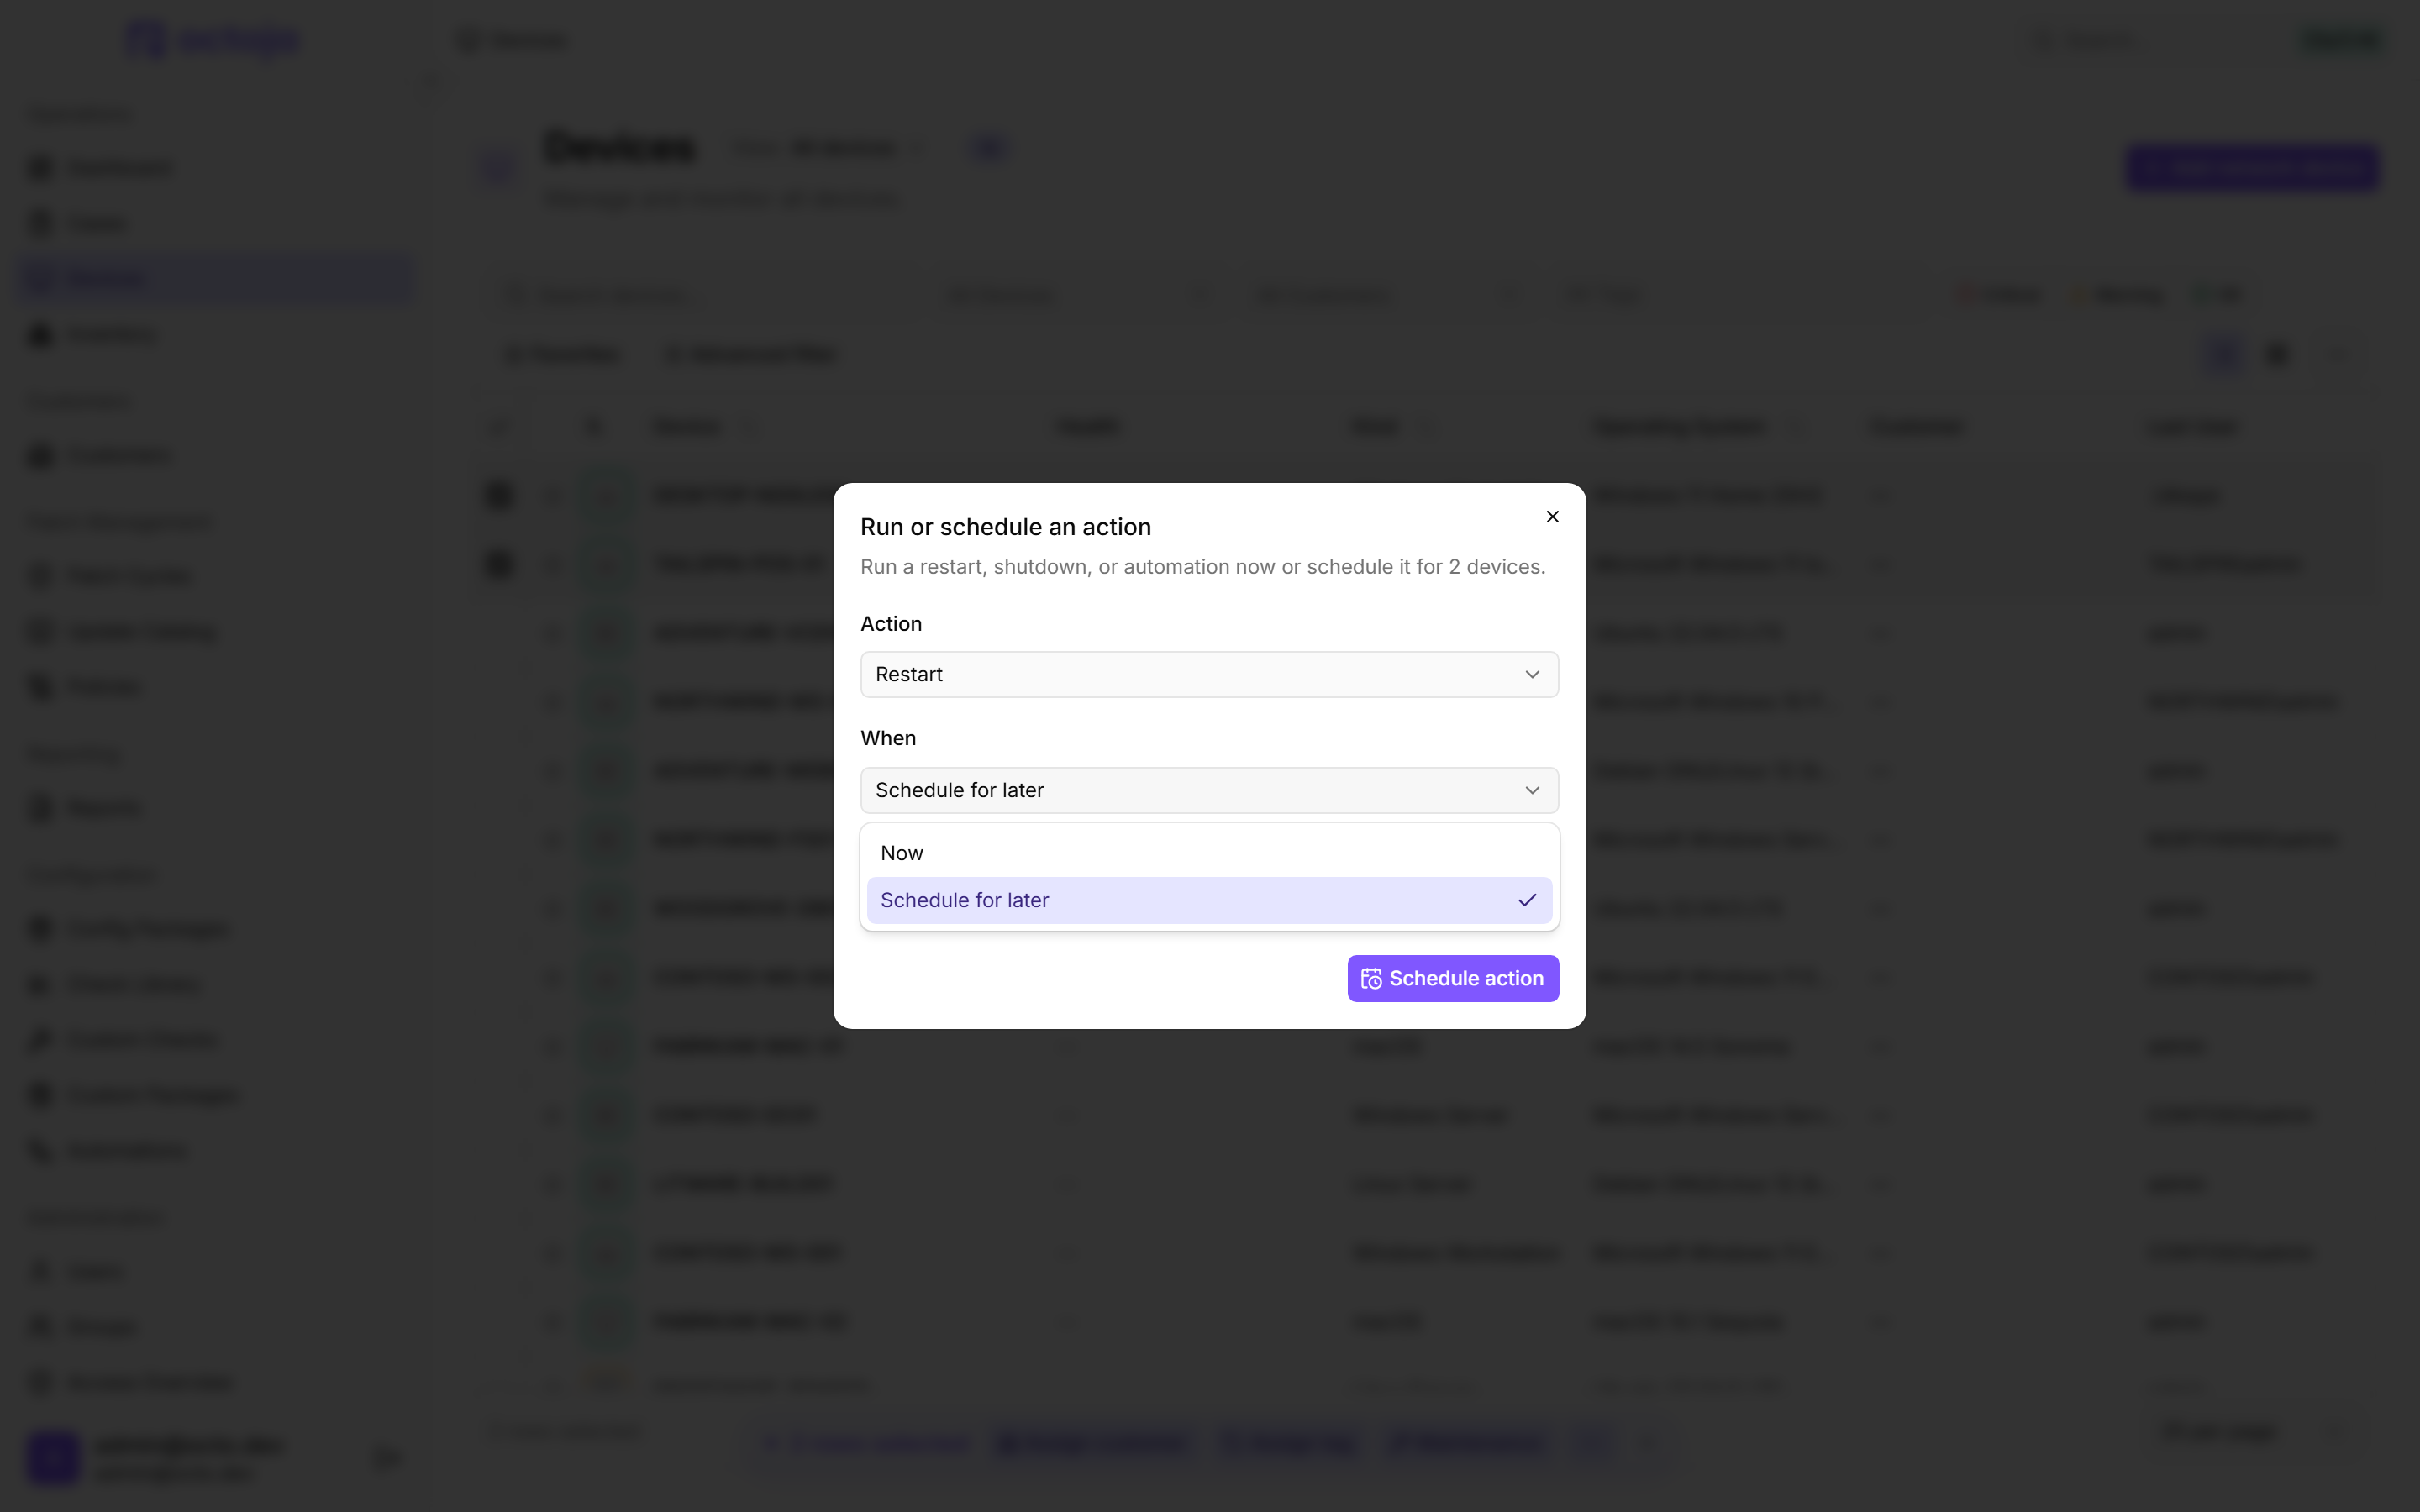
  • Schedule automations and reports to run every few hours — Automation triggers, a config package's "Schedule override" and report schedules now offer the "Every few hours" mode, repeating every 1, 2, 3, 4, 6, 8 or 12 hours.
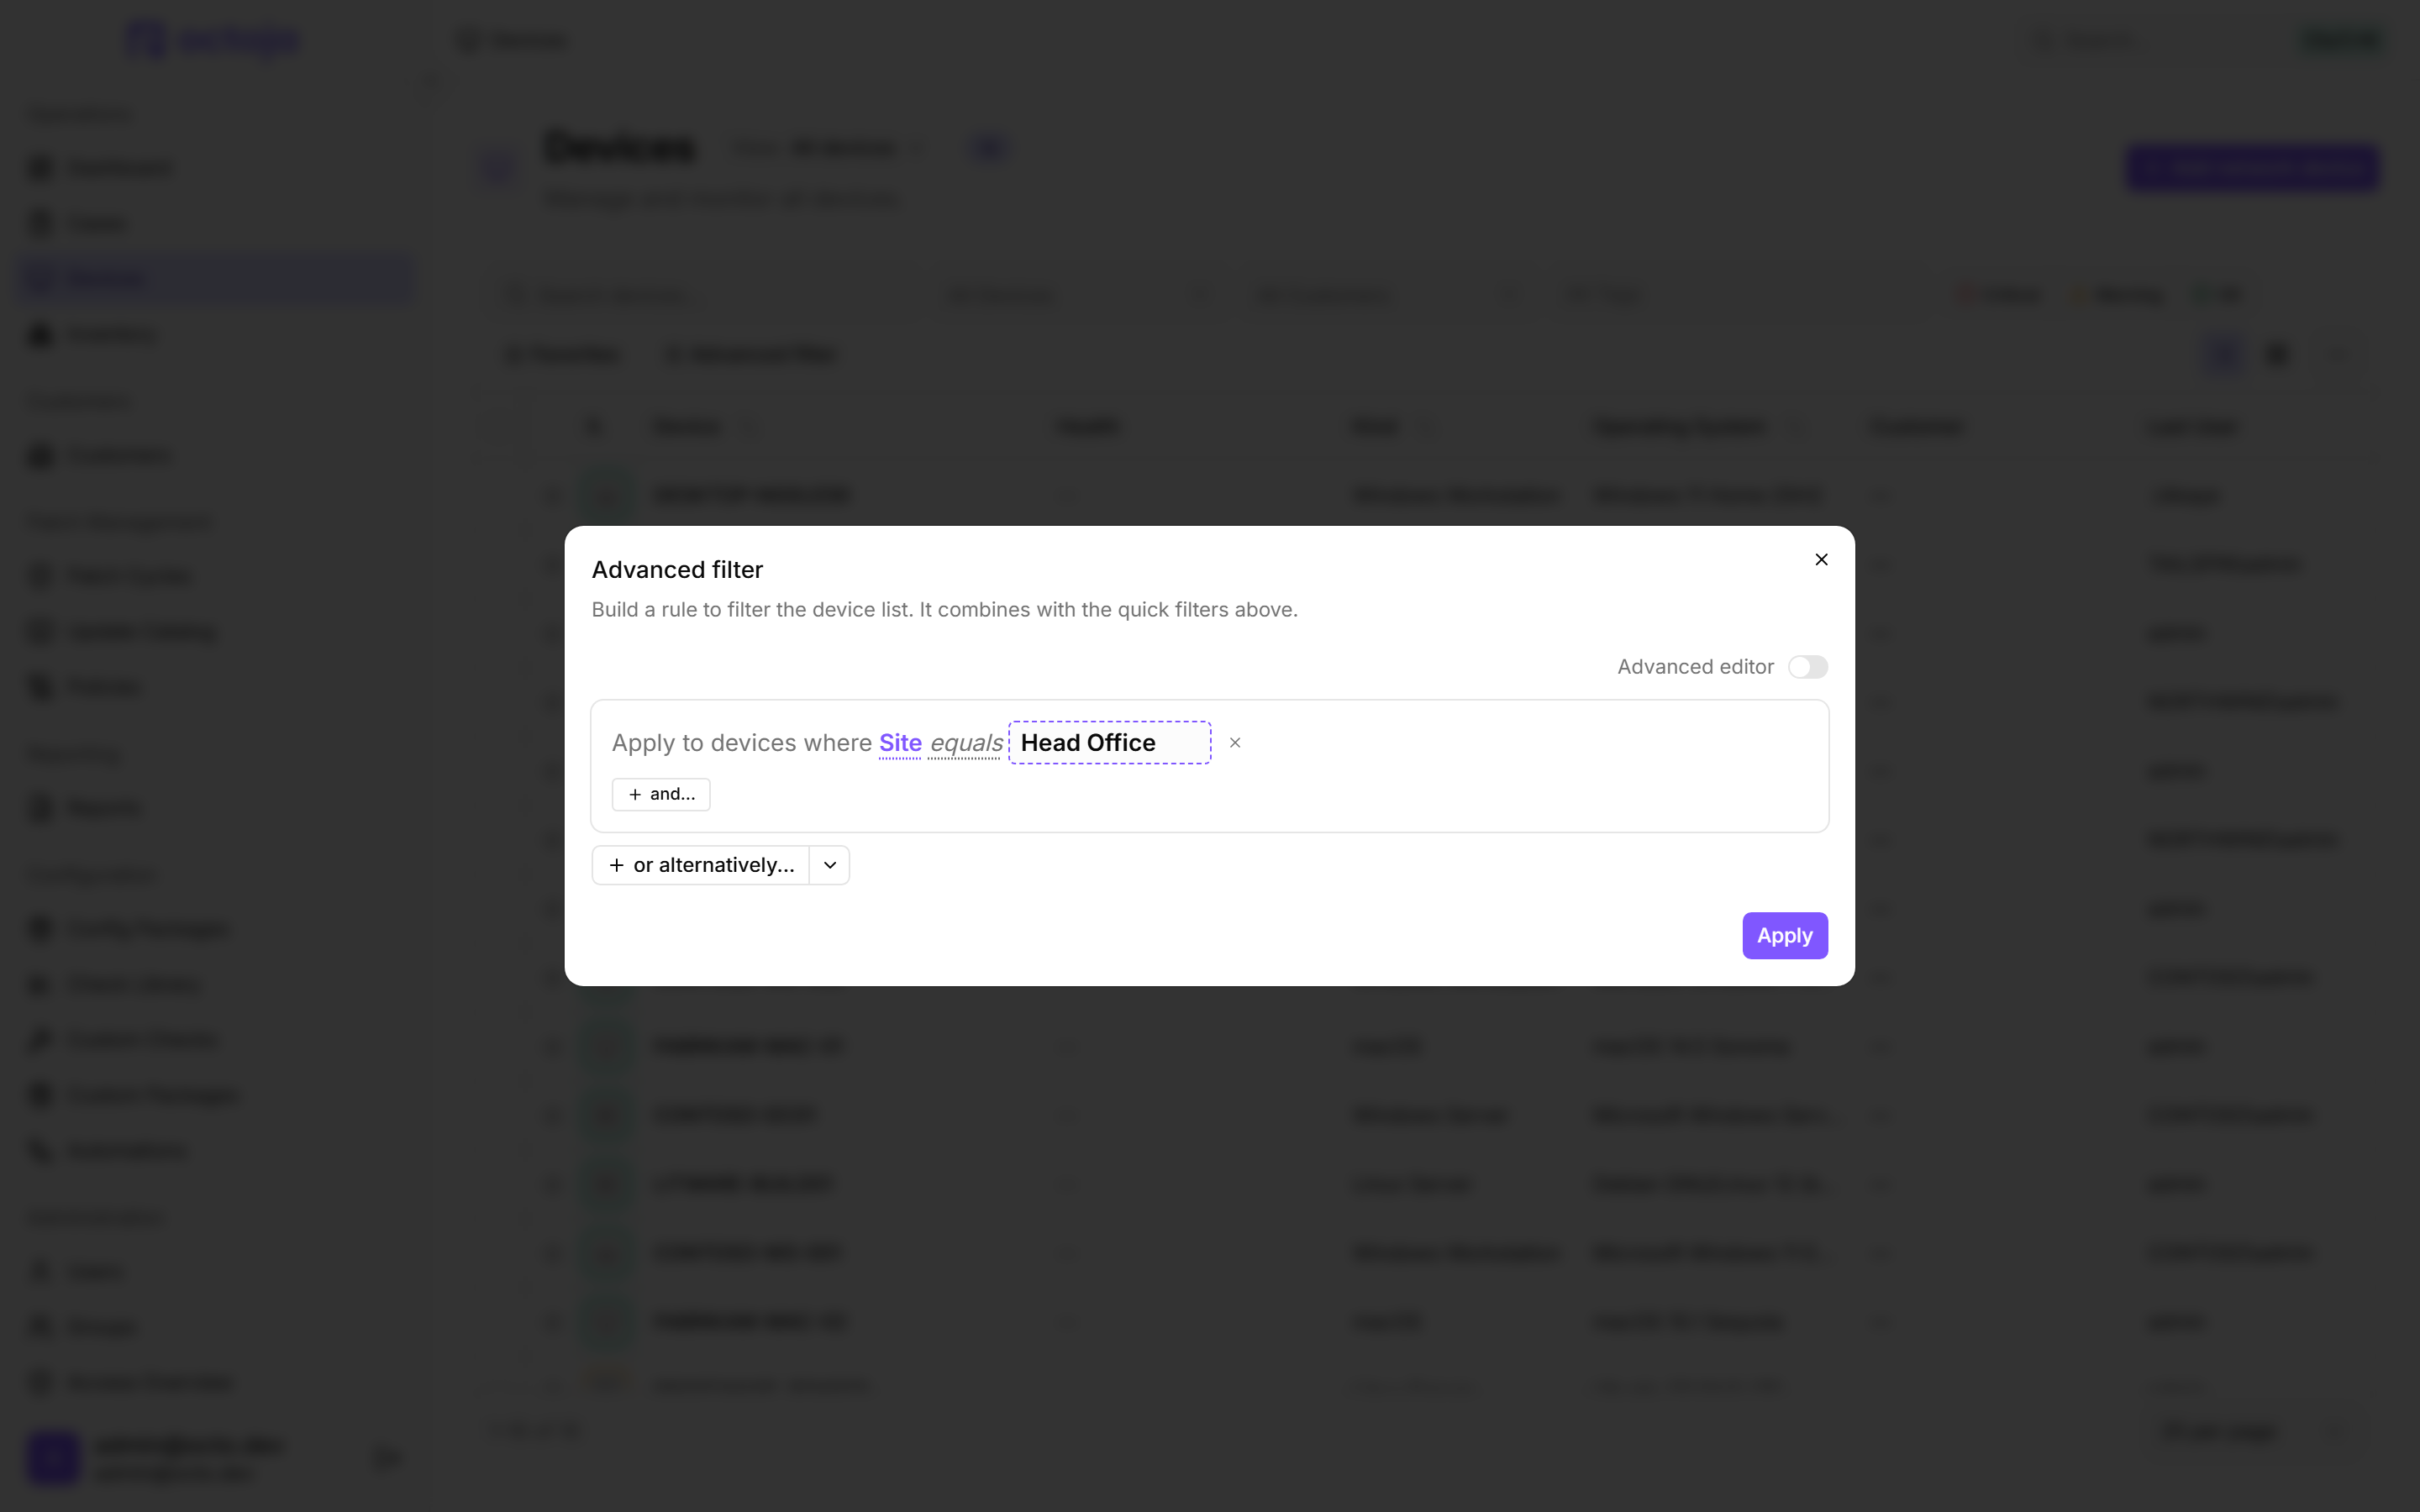
  • Rule builder suggests real fleet values and previews matches — Application and service conditions now suggest names actually found across your fleet with a device count each, preview which devices match, and a new "All Devices" template matches every device; the chassis-type condition also offers a pick list instead of free text.
  • Rule templates in automation targeting and group device access — "Add from Template" now also appears under "Target devices" for an automation and "Device rules" for a permission group.
  • Case comments update live — New comments appear in an open case automatically, with no reload — whether from a colleague or the person who reported it.
  • Smoother remote desktop on slow connections — When the viewer cannot keep up, octoja lowers the frame rate and skips frames instead of building a backlog, then recovers with a fresh full image.
  • Lists fill the page height with pinned column headers — Long lists use the whole window and keep column headers pinned as you scroll, so you don’t lose track of which column is which.
  • The whole device row is clickable, not just the name — This applies in the device list and the Inventory "Hardware" tab; middle-click or Ctrl-click opens the device in a new tab.
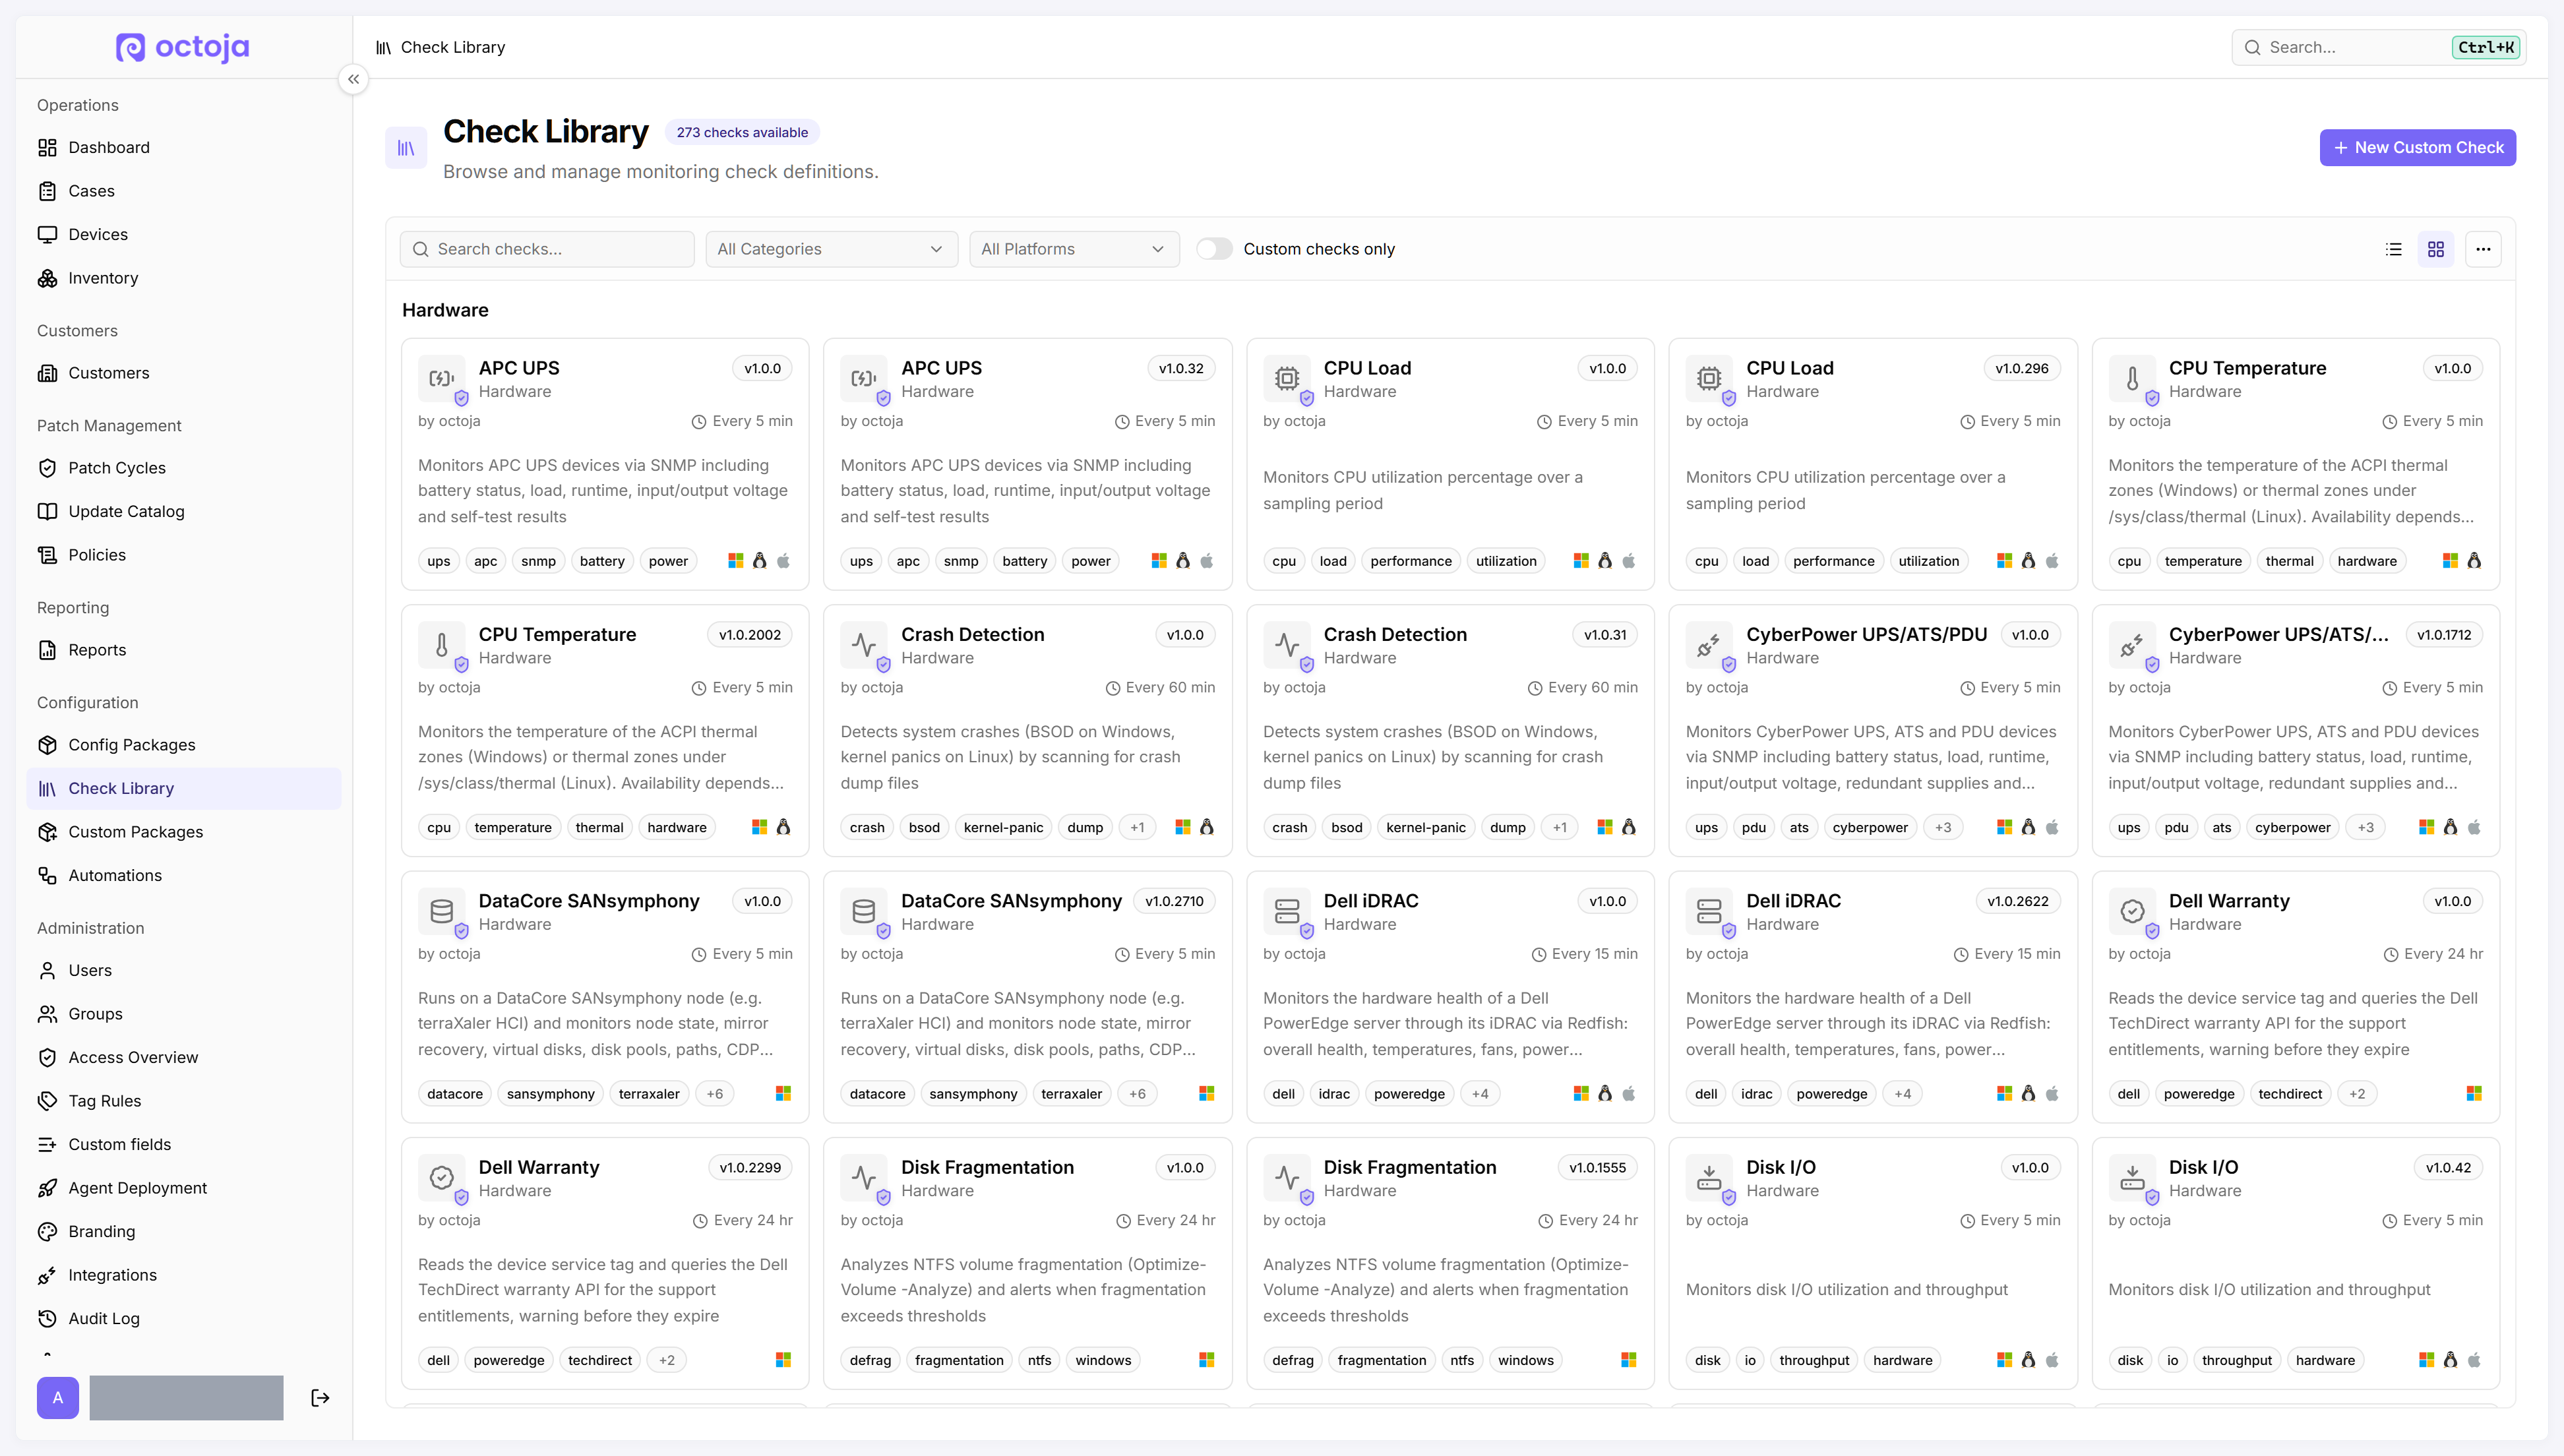
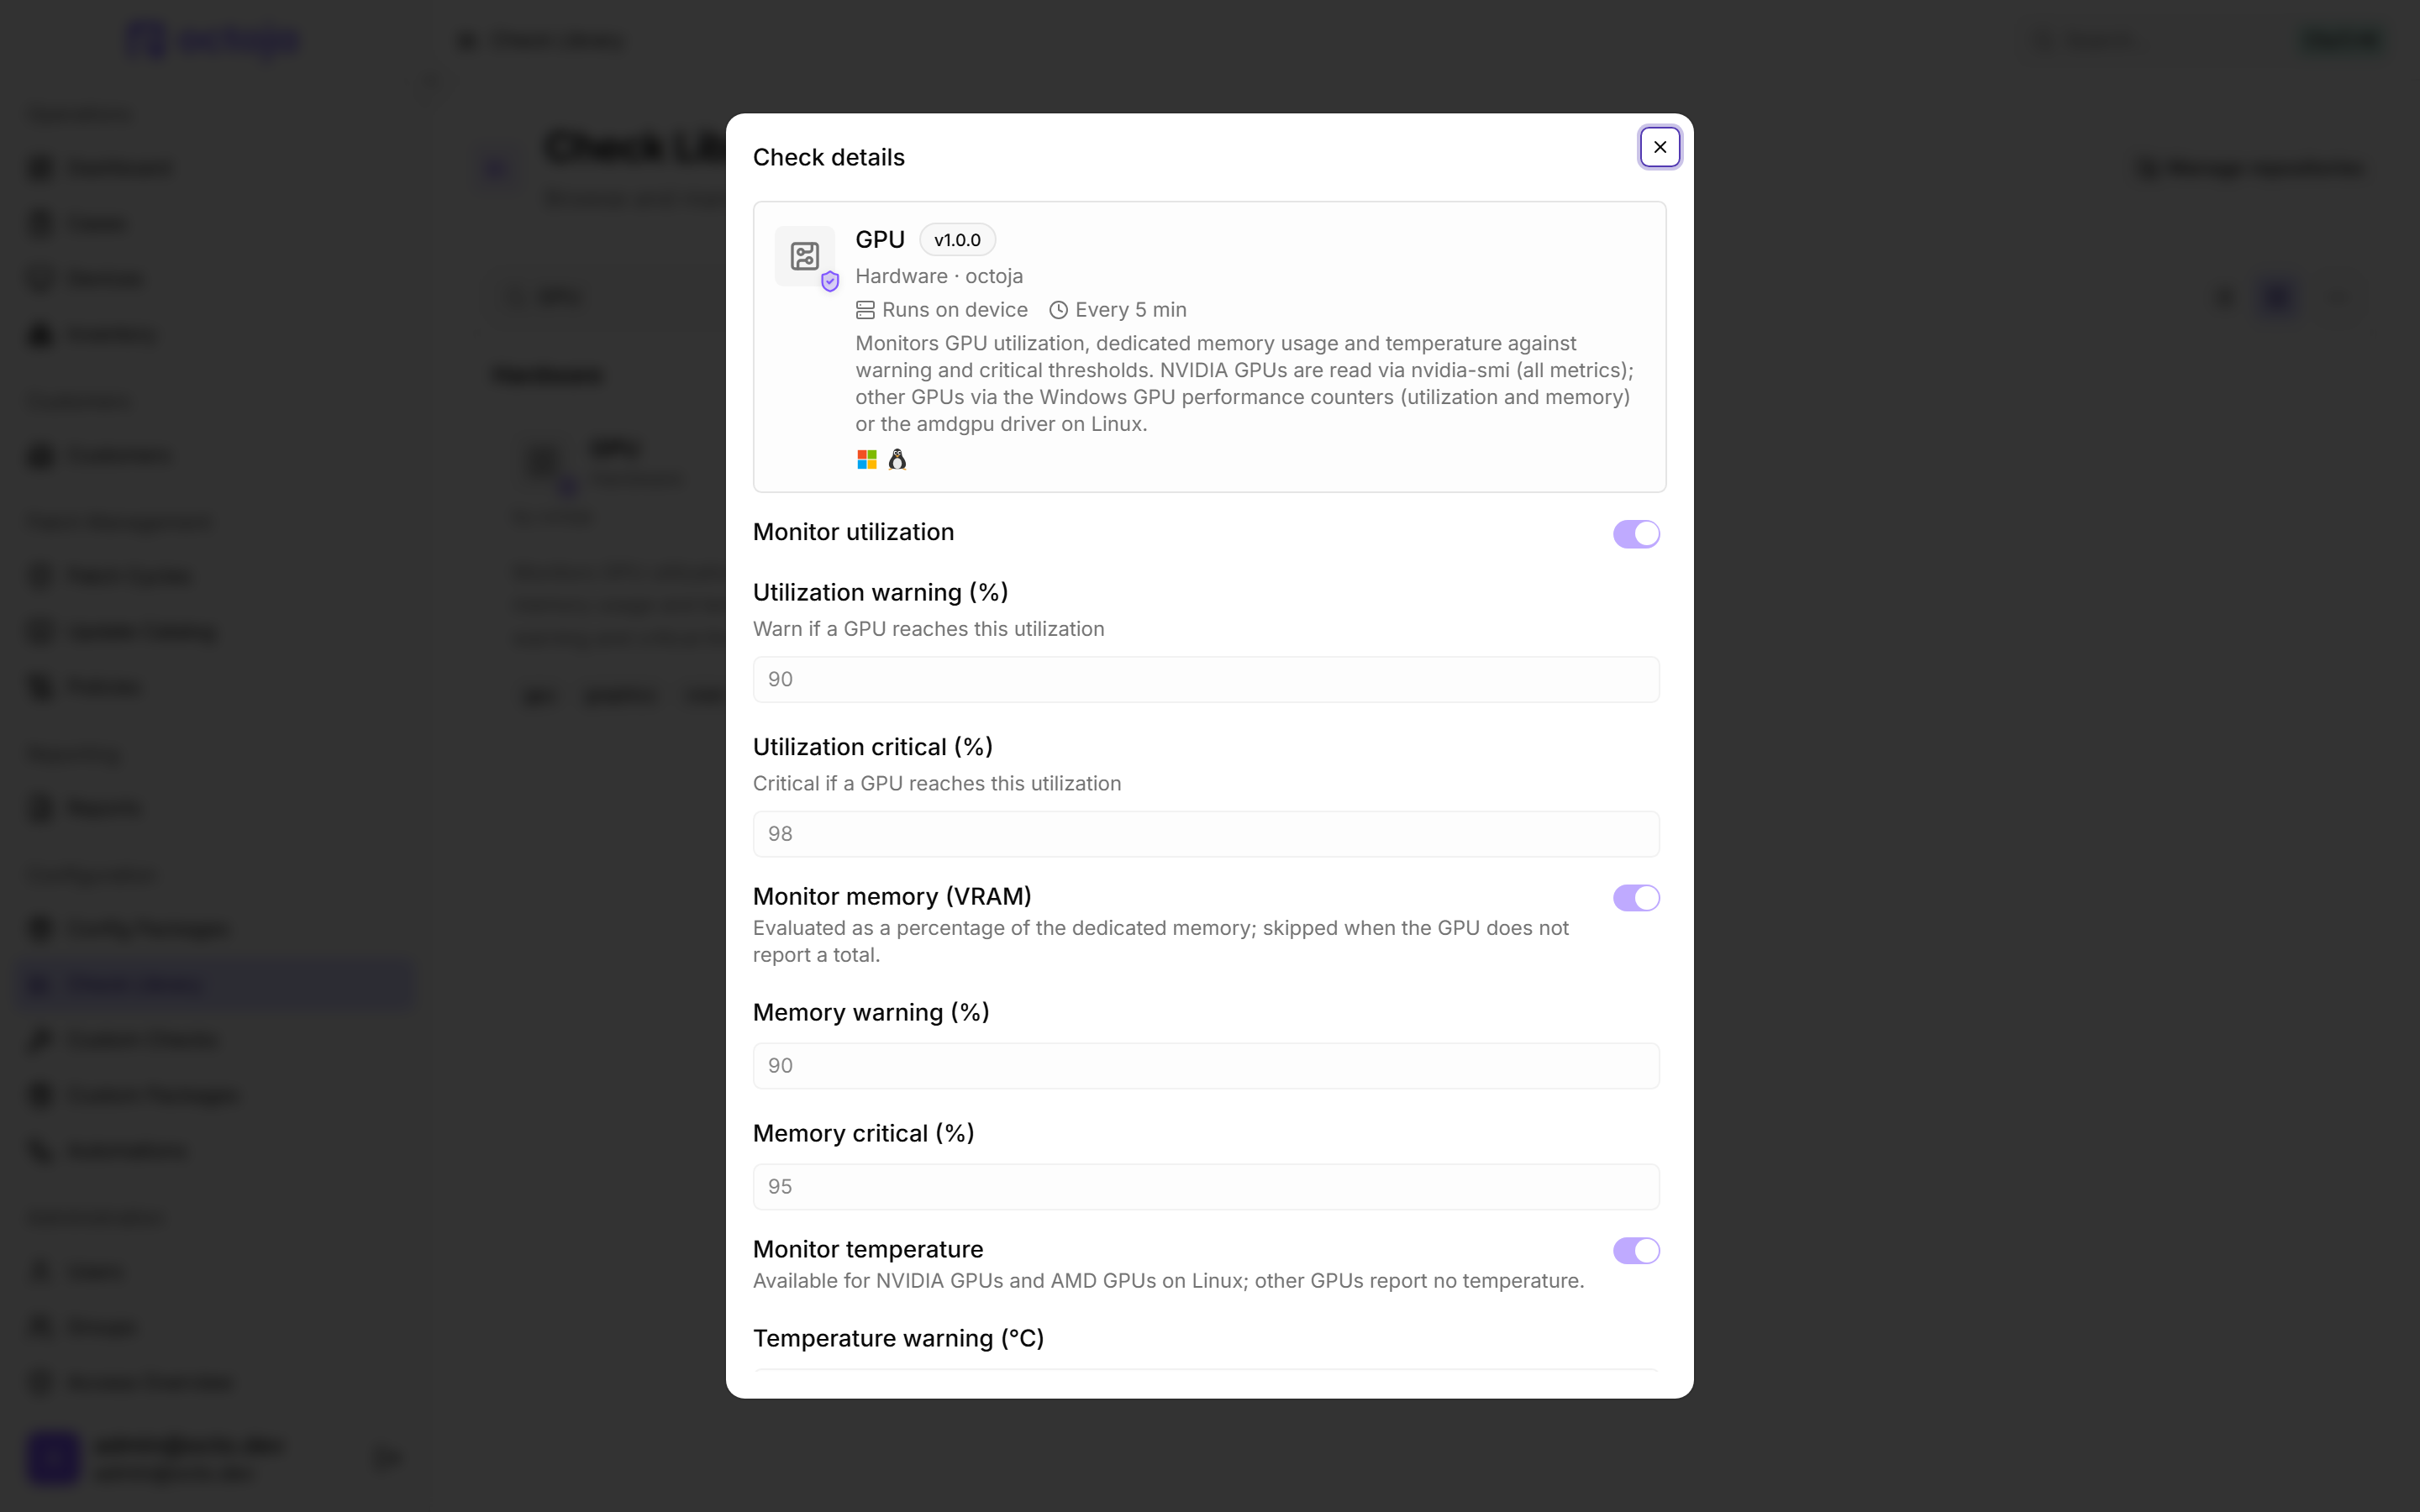

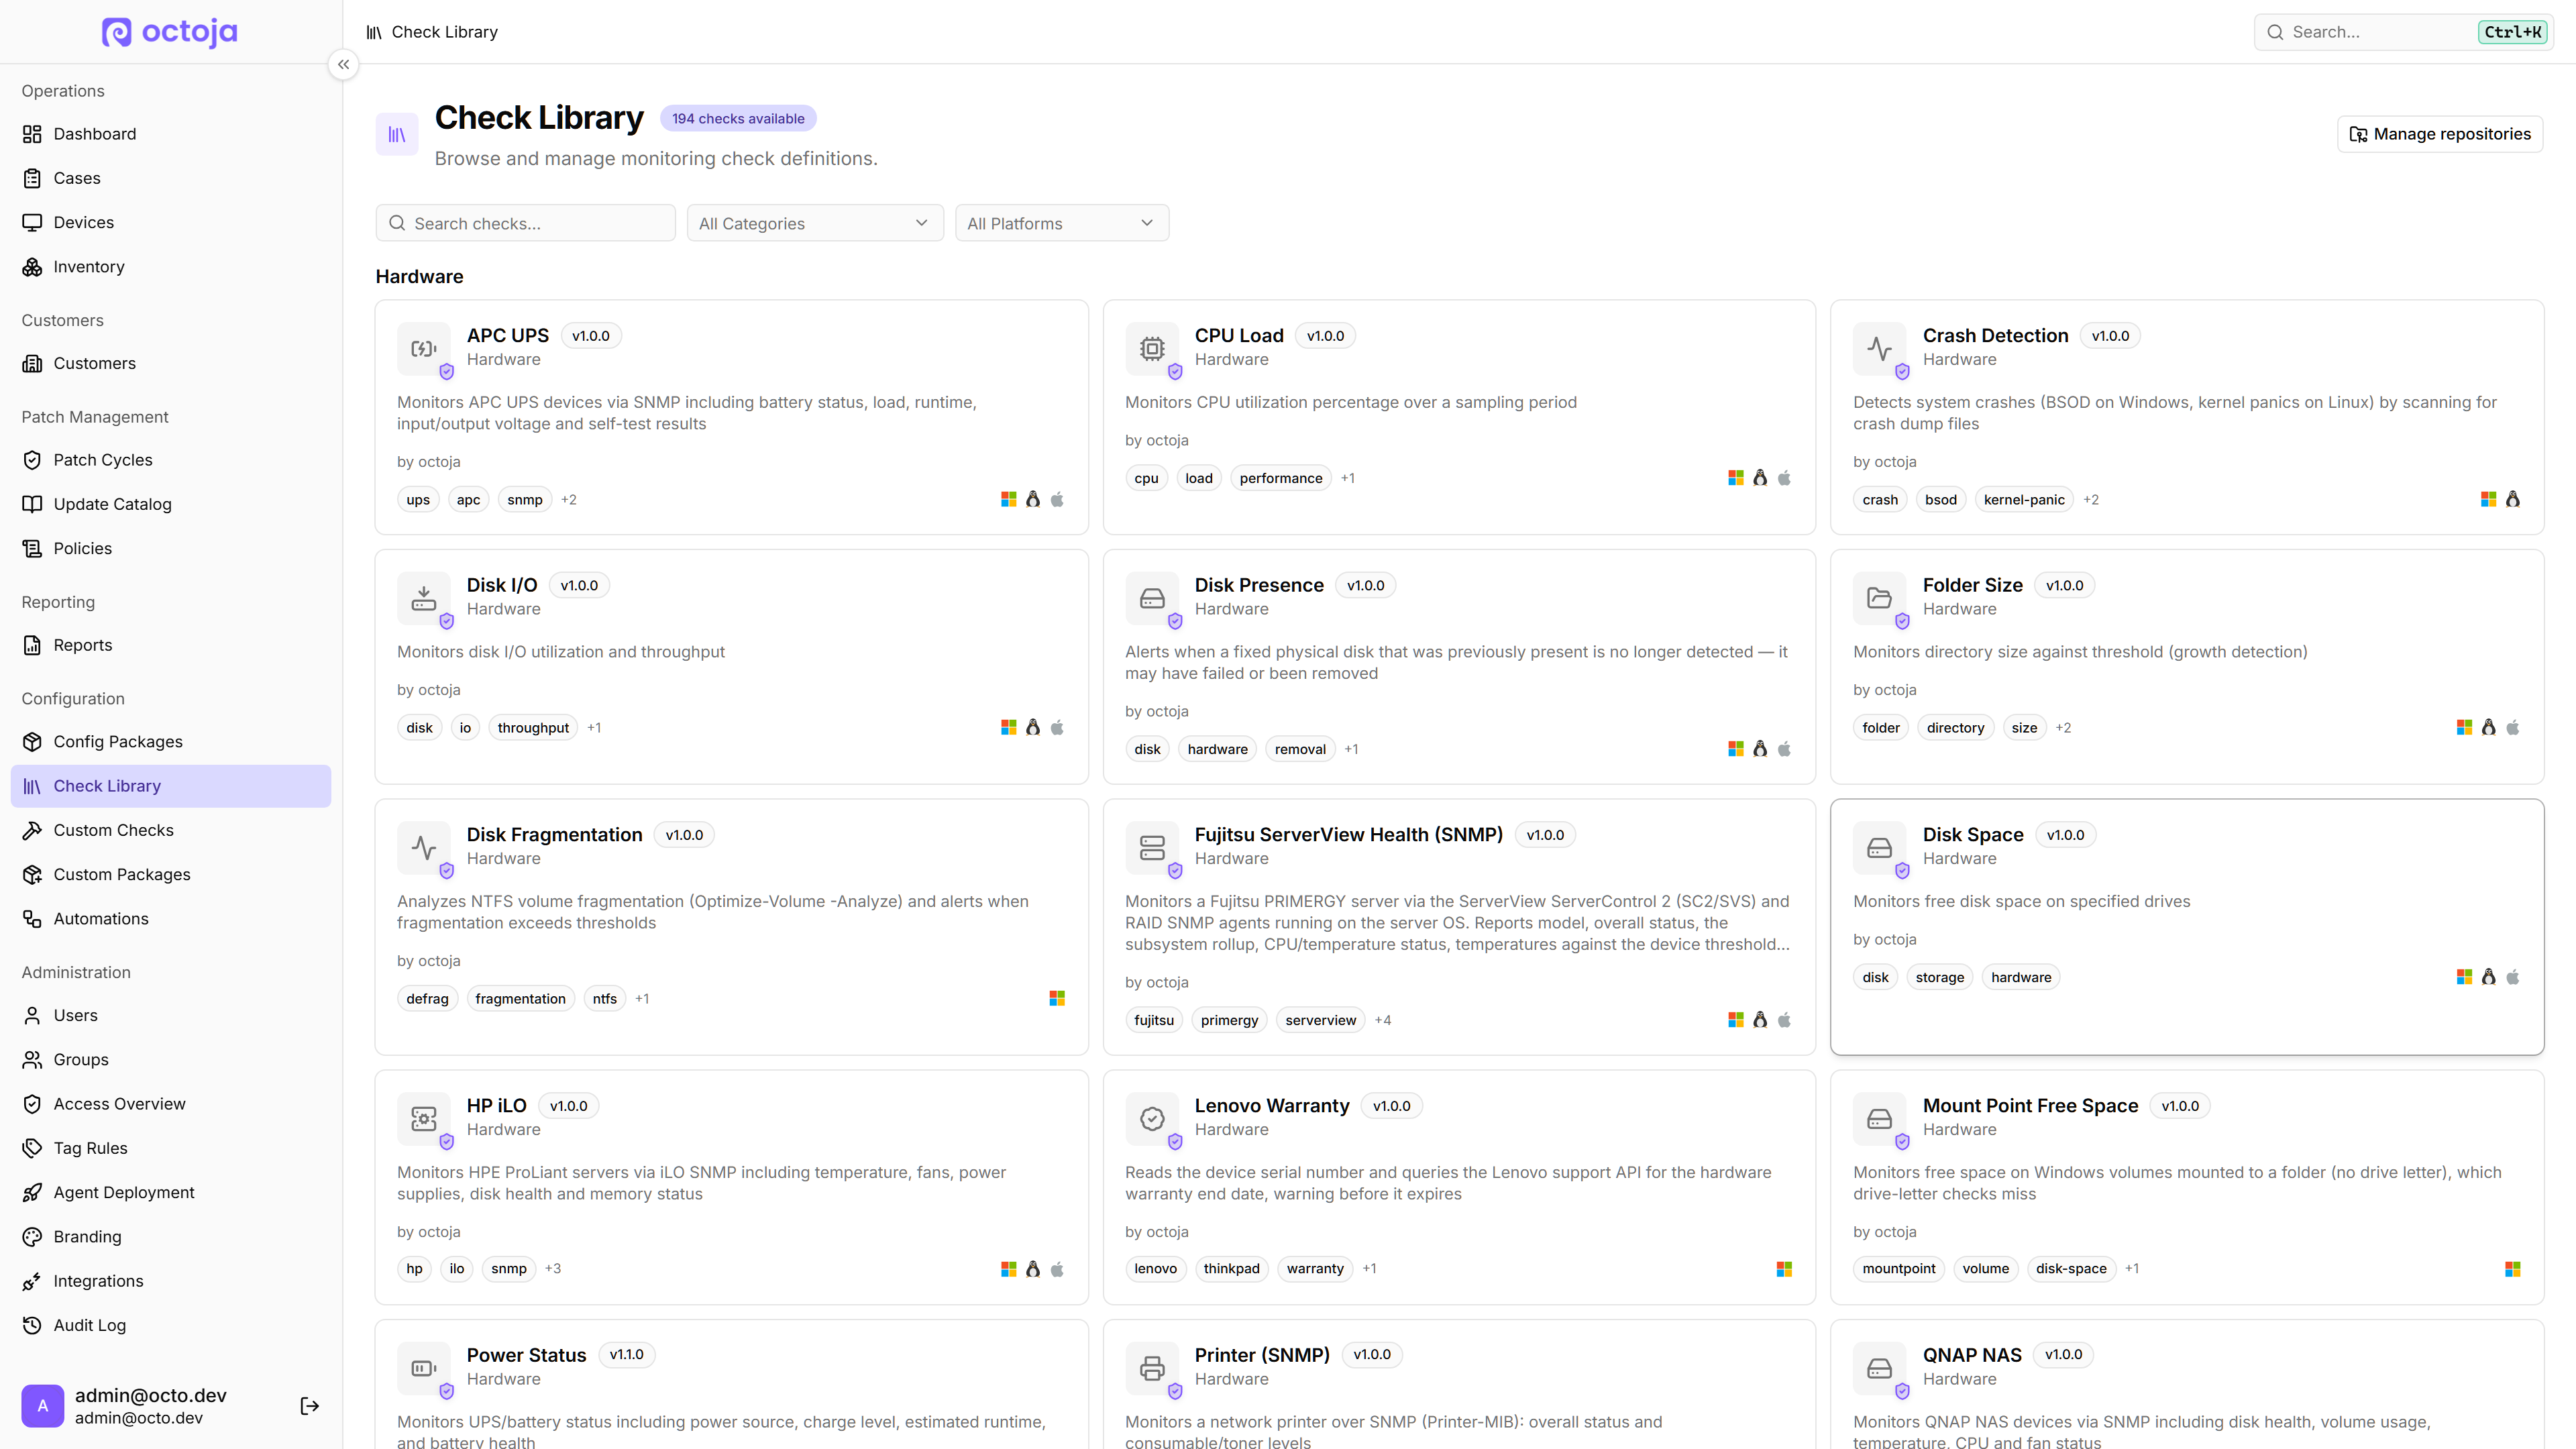
  • Check Library is faster and more informative — The Check Library opens noticeably faster and adds a sortable table view alongside the cards, and clicking a check opens a read-only preview of its full configuration.
    Check Library is faster and more informative
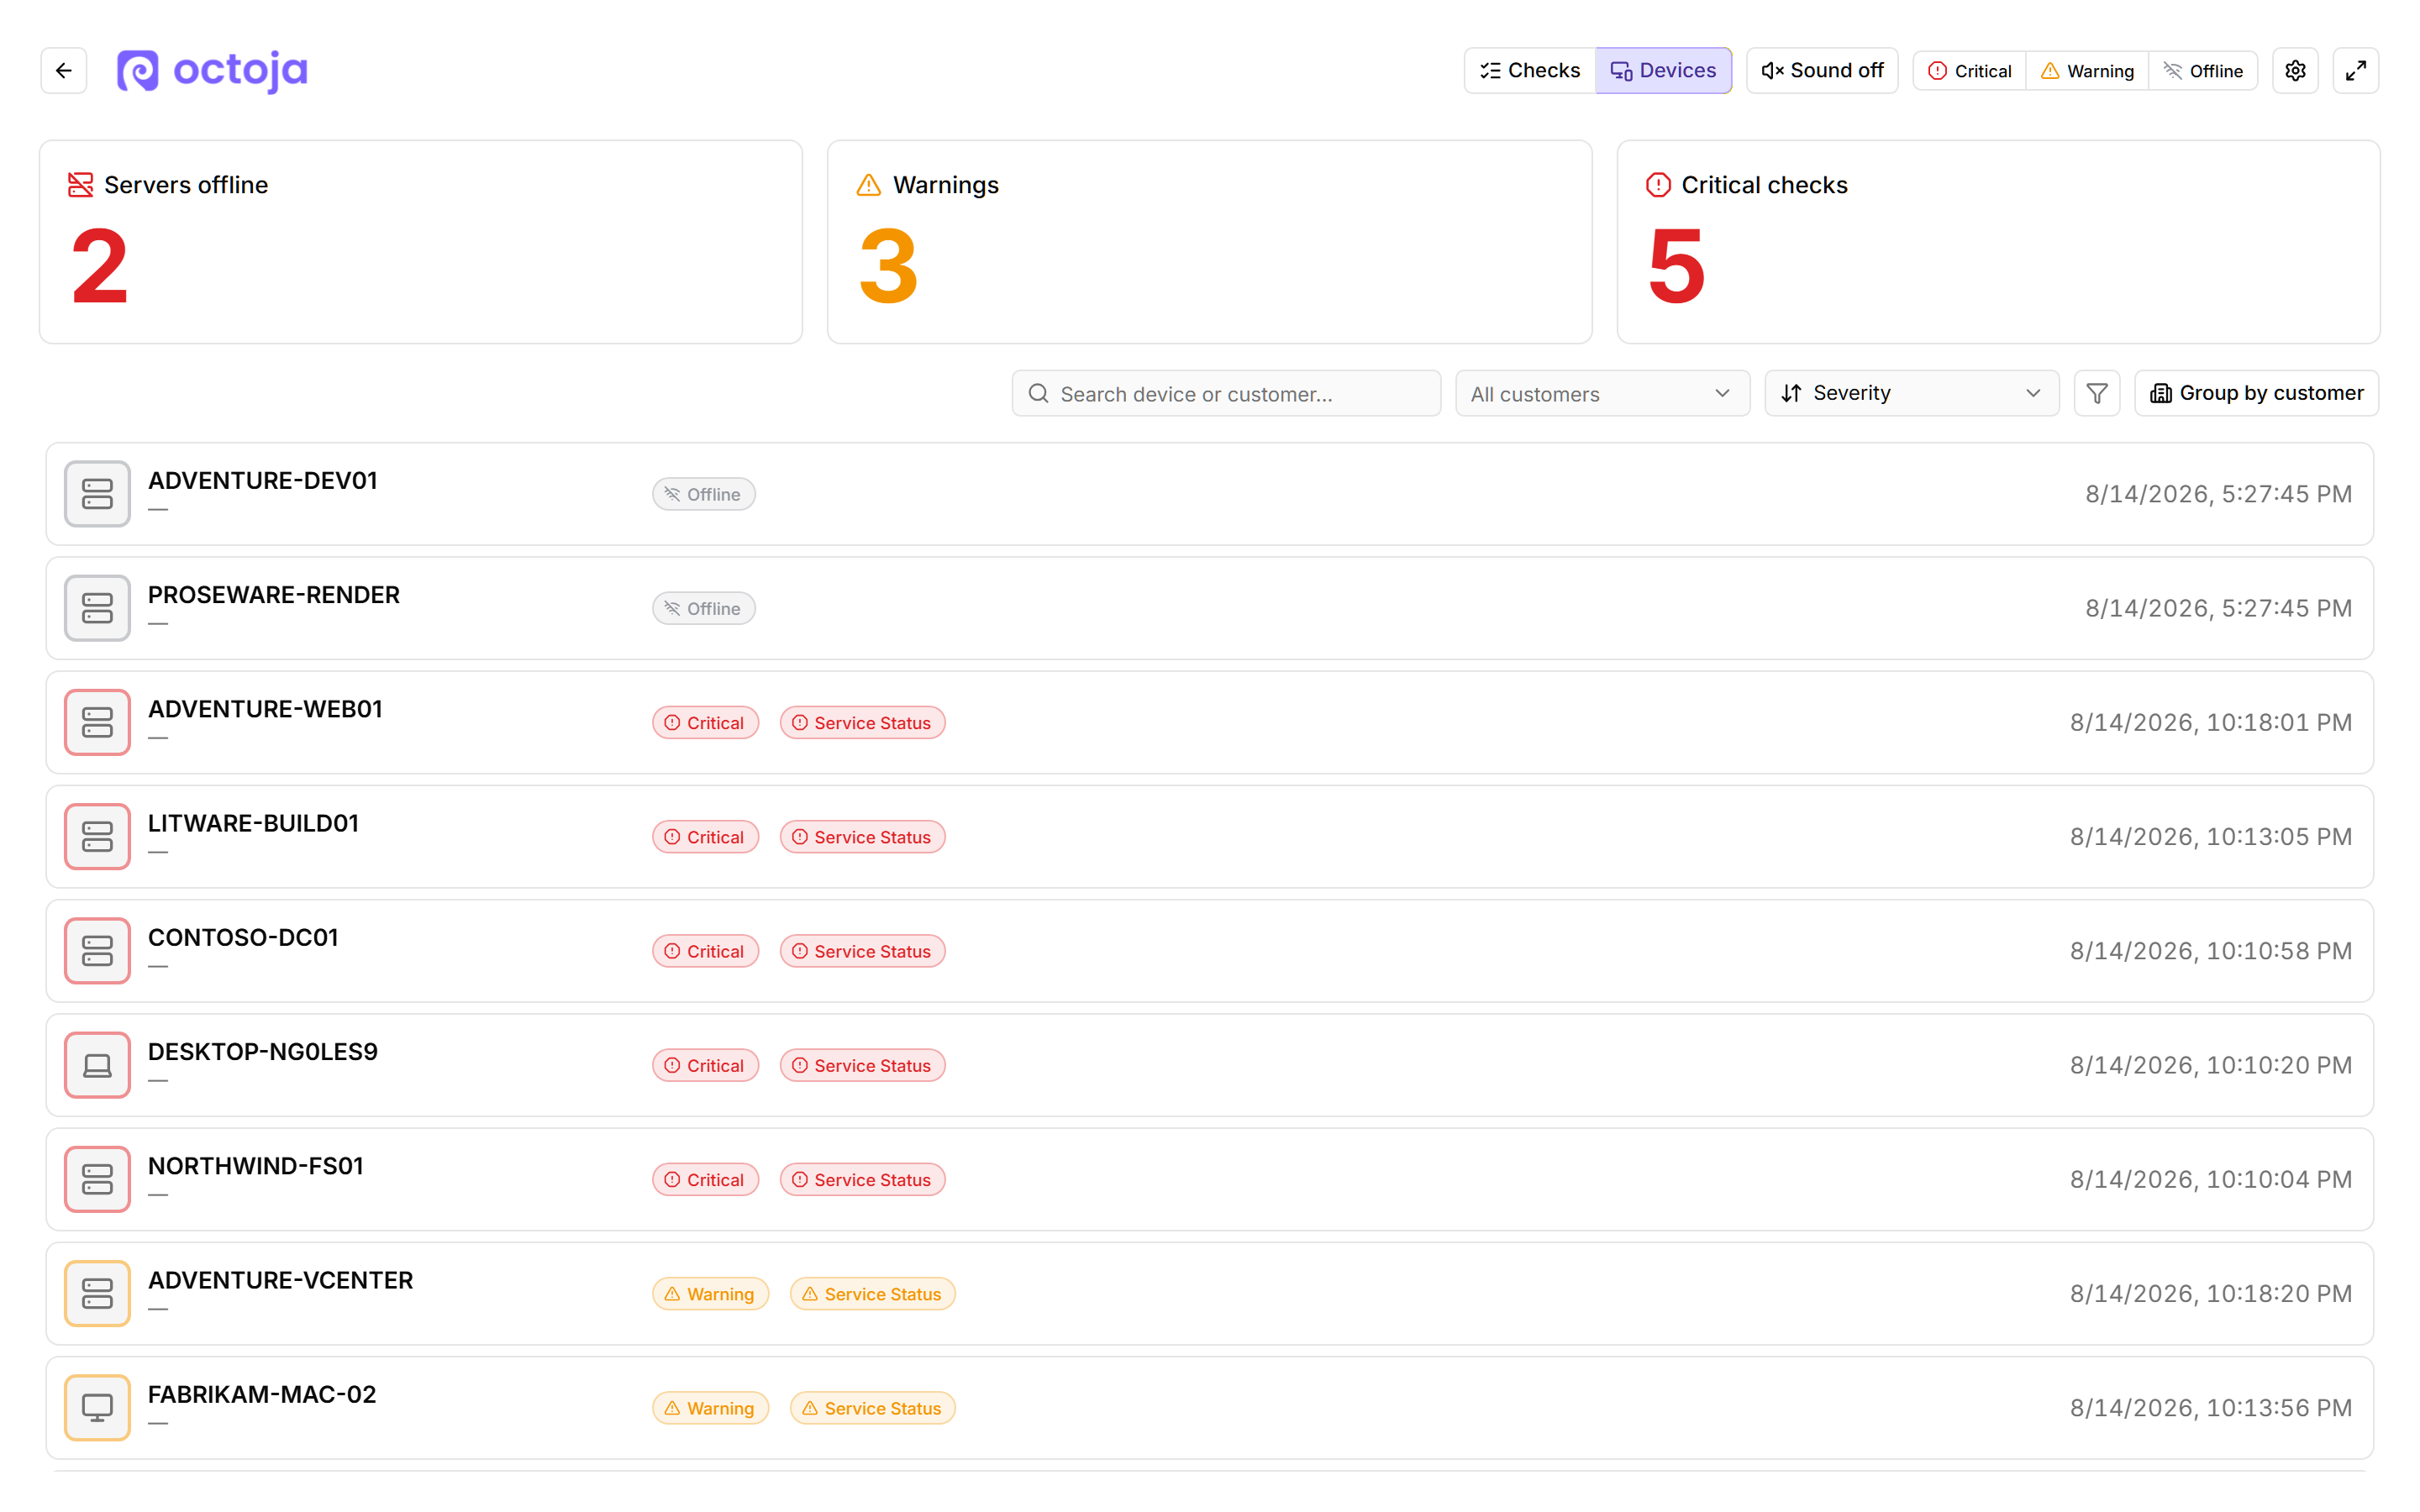
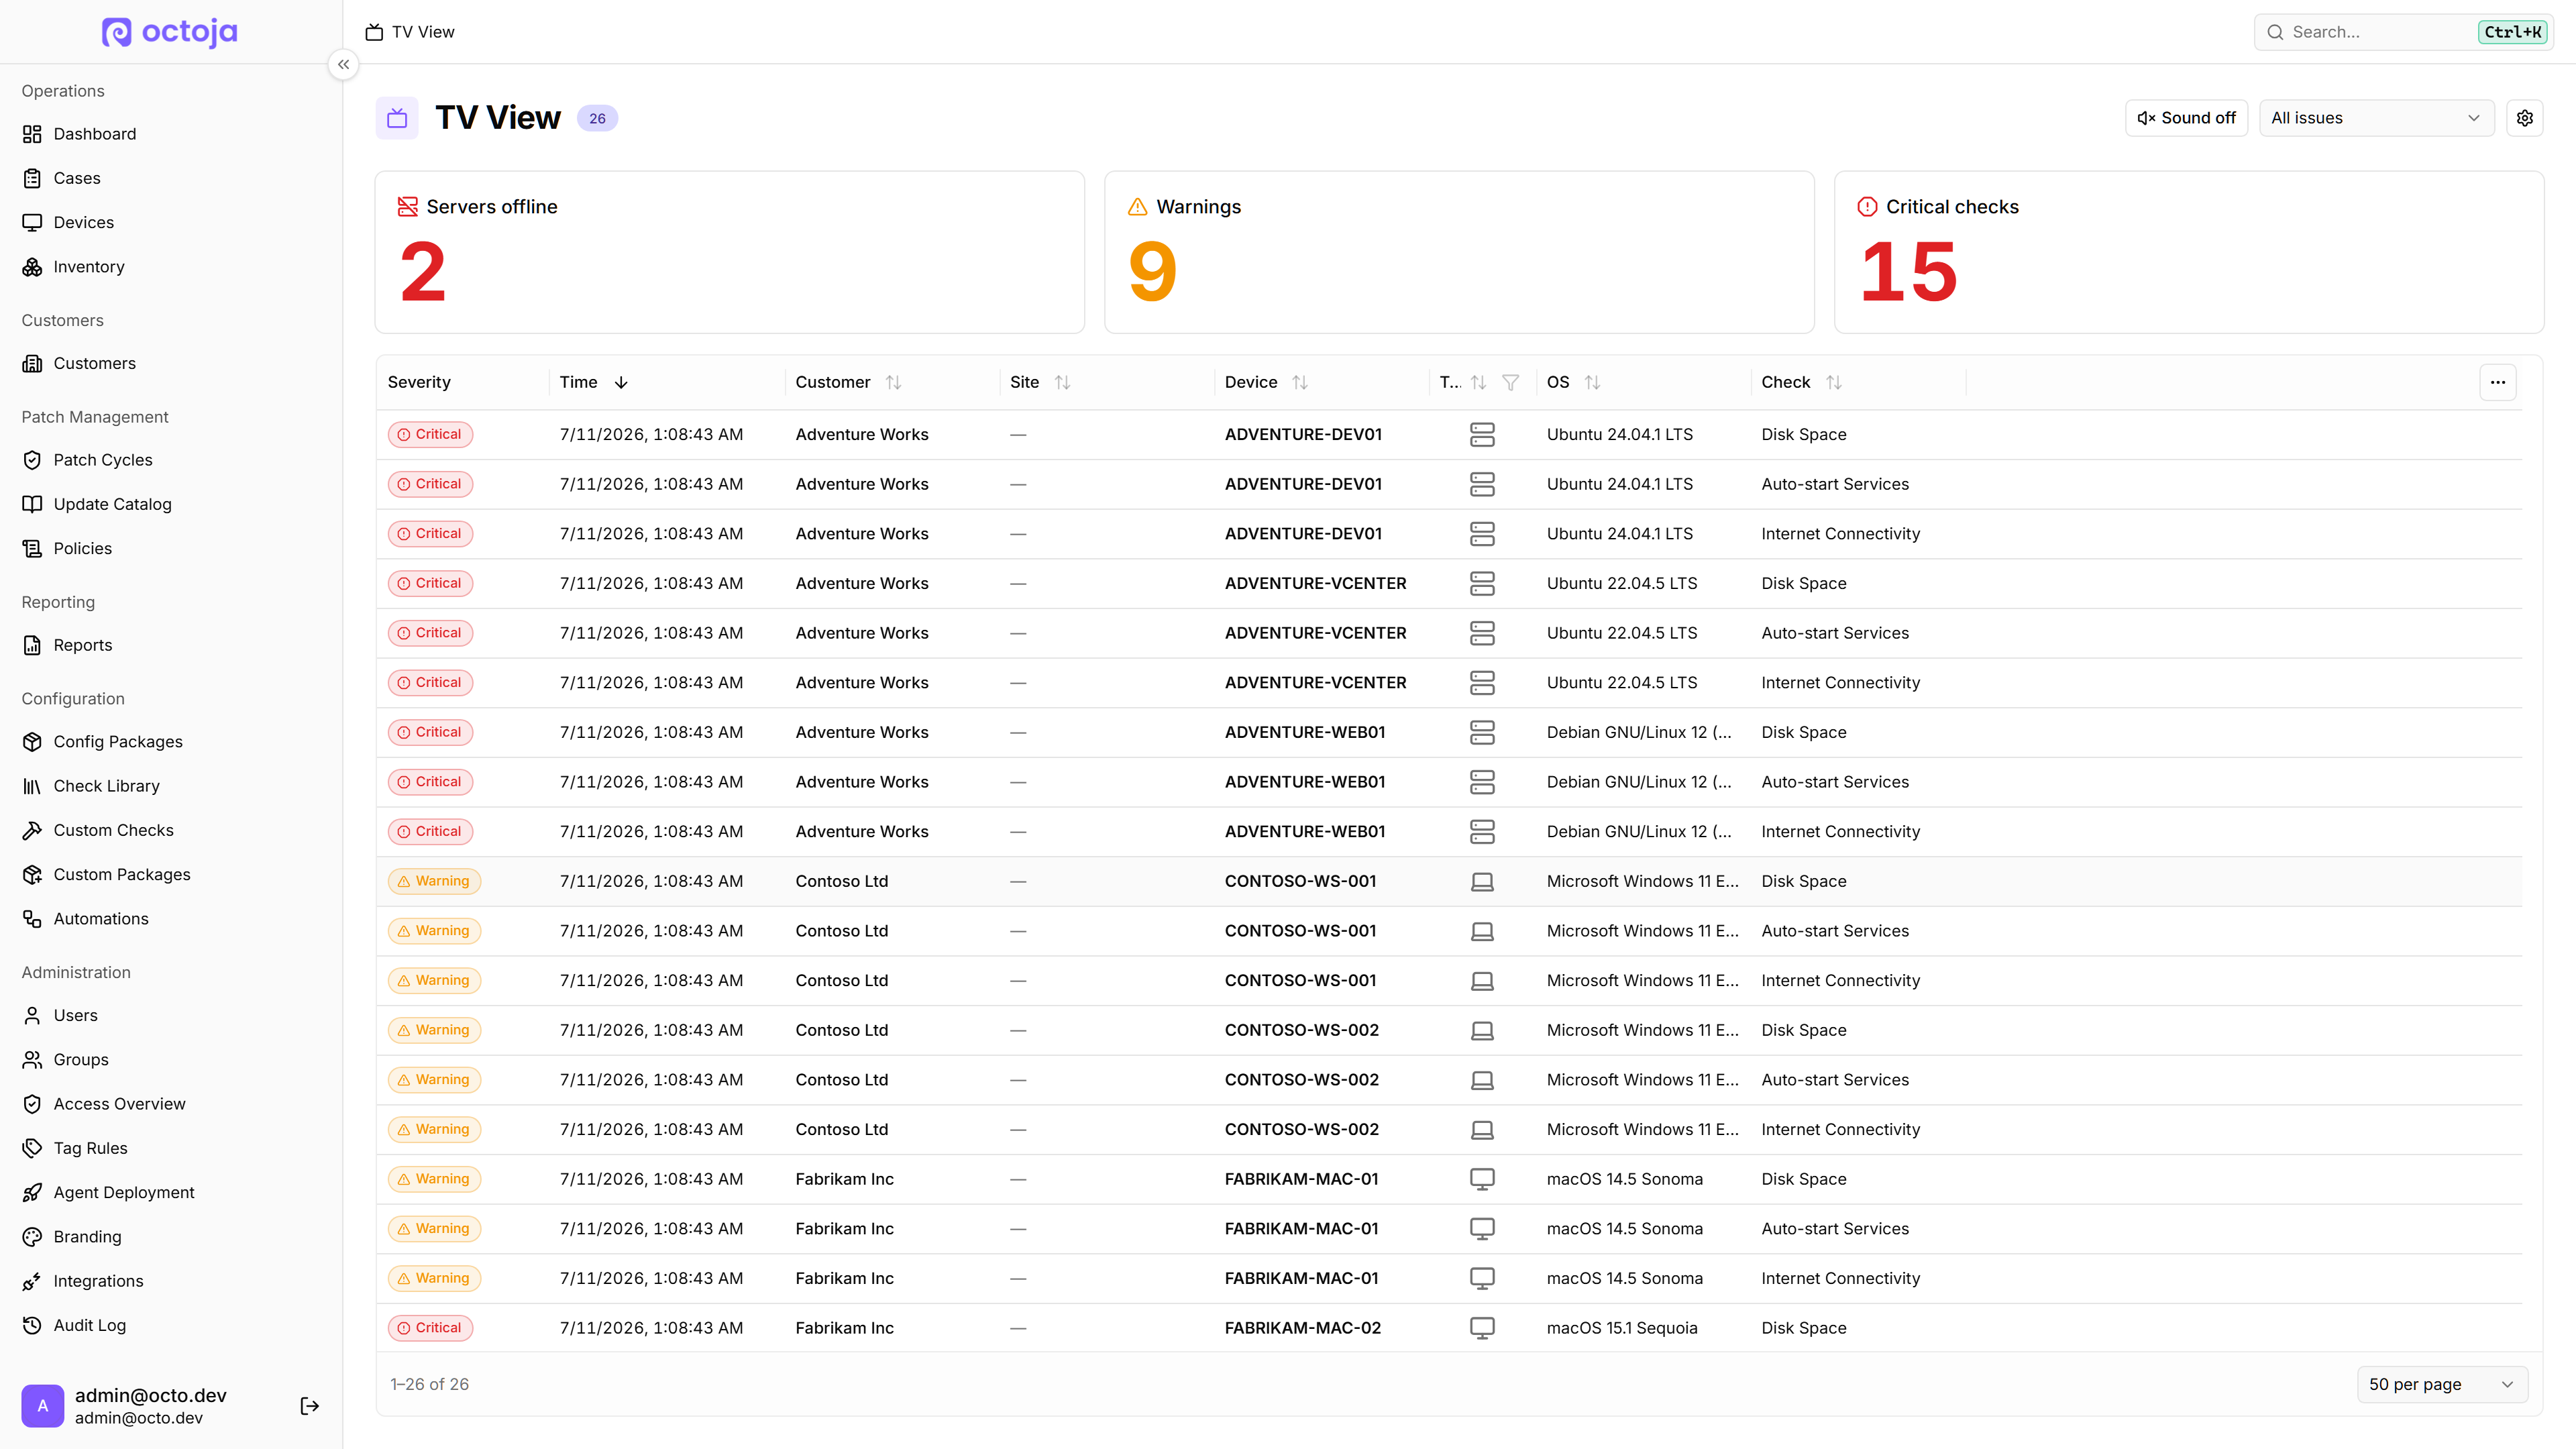
  • TV View runs as a full-screen wall board — The dashboard TV View now fills the entire window with no sidebar or app header, shows your branding logo, and adds a "Fullscreen" toggle.
    TV View runs as a full-screen wall board
  • Failed Logon Alert is now Failed Logins, and covers Linux and macOS — It lists each failed attempt with time, user, origin and logon type, and uses its own time window and minimum count per severity.
  • SentinelOne now reports a clear threat status — The SentinelOne check now reports a "Threat status" of "None" or "Not mitigated" on Windows and macOS, instead of counting quarantined files that linger after a threat is contained.
  • Network Firewall check adds Sophos XG / XGS over SNMP — The "Network Firewall (Appliance)" check adds "Sophos XG / XGS (SNMP)" alongside the local variant, reporting CPU, memory and disk use, uptime, VPN tunnels and interfaces.
  • Altaro and Hornetsecurity VM Backup 9 report in more detail — The Altaro Backup check now reports "Local backup", "Offsite copy" and "Restore / verification" separately, each with its last success, recognises Hornetsecurity VM Backup 9 too, and shows the reason (VM name and message) on a warned or failed backup.
  • TERRA CLOUD Backup adds Hyper-V and expected backup days — The TERRA CLOUD Backup check now covers Hyper-V backups per virtual machine, and "Expected backup days" with a "Grace period (hours)" govern when a backup counts as "Overdue".
  • Windows event log check can include events, not just exclude — Matches on event ID, source and message text, and „Minimum severity" now extends coverage through Information and Verbose.
  • Network Interface check can ignore dead ports — An „Interfaces to ignore" option suggests the device's last-seen interfaces, so disconnected ports stop alerting while unlisted ones stay monitored.
  • UniFi (SNMP) check can watch specific interfaces — Pick the ports the check should monitor, so on busy switches it reports only the interfaces you care about.
  • System Updates can count optional and preview Windows updates — Turn on „Show advanced options", then „Include optional / preview updates (Windows)" to count optional, non-security updates like preview cumulative updates.
  • QNAP check reports RAID health per storage pool — A "Storage Pools" section flags a degraded or rebuilding array as Critical, so you don't have to open the NAS interface; CPU temperature also gains its own warning and critical thresholds.
  • Printer (SNMP) check picks up Brother toner and jam detail — Reads per-colour toner state, a paper-jam warning with location, and a „Colour" versus „Mono" page split from Brother printers.
  • MailStore SPE check adds archiving runs and certificate expiry — „Check archiving profile runs" flags profiles whose latest run failed, and „Monitor certificate expiry" warns before the SPE management server's certificate expires.
  • Custom checks can run longer than five minutes — A new „Timeout (min)" field accepts up to 60 minutes; existing checks keep the five-minute default until you change it.
  • Manual check runs name the real failure reason
  • Monitoring checks wait five minutes after a device restarts — This way a check's first result reflects a fully started system rather than one still booting; manual runs stay immediate.
  • Remote actions and single sign-on linking show the real error
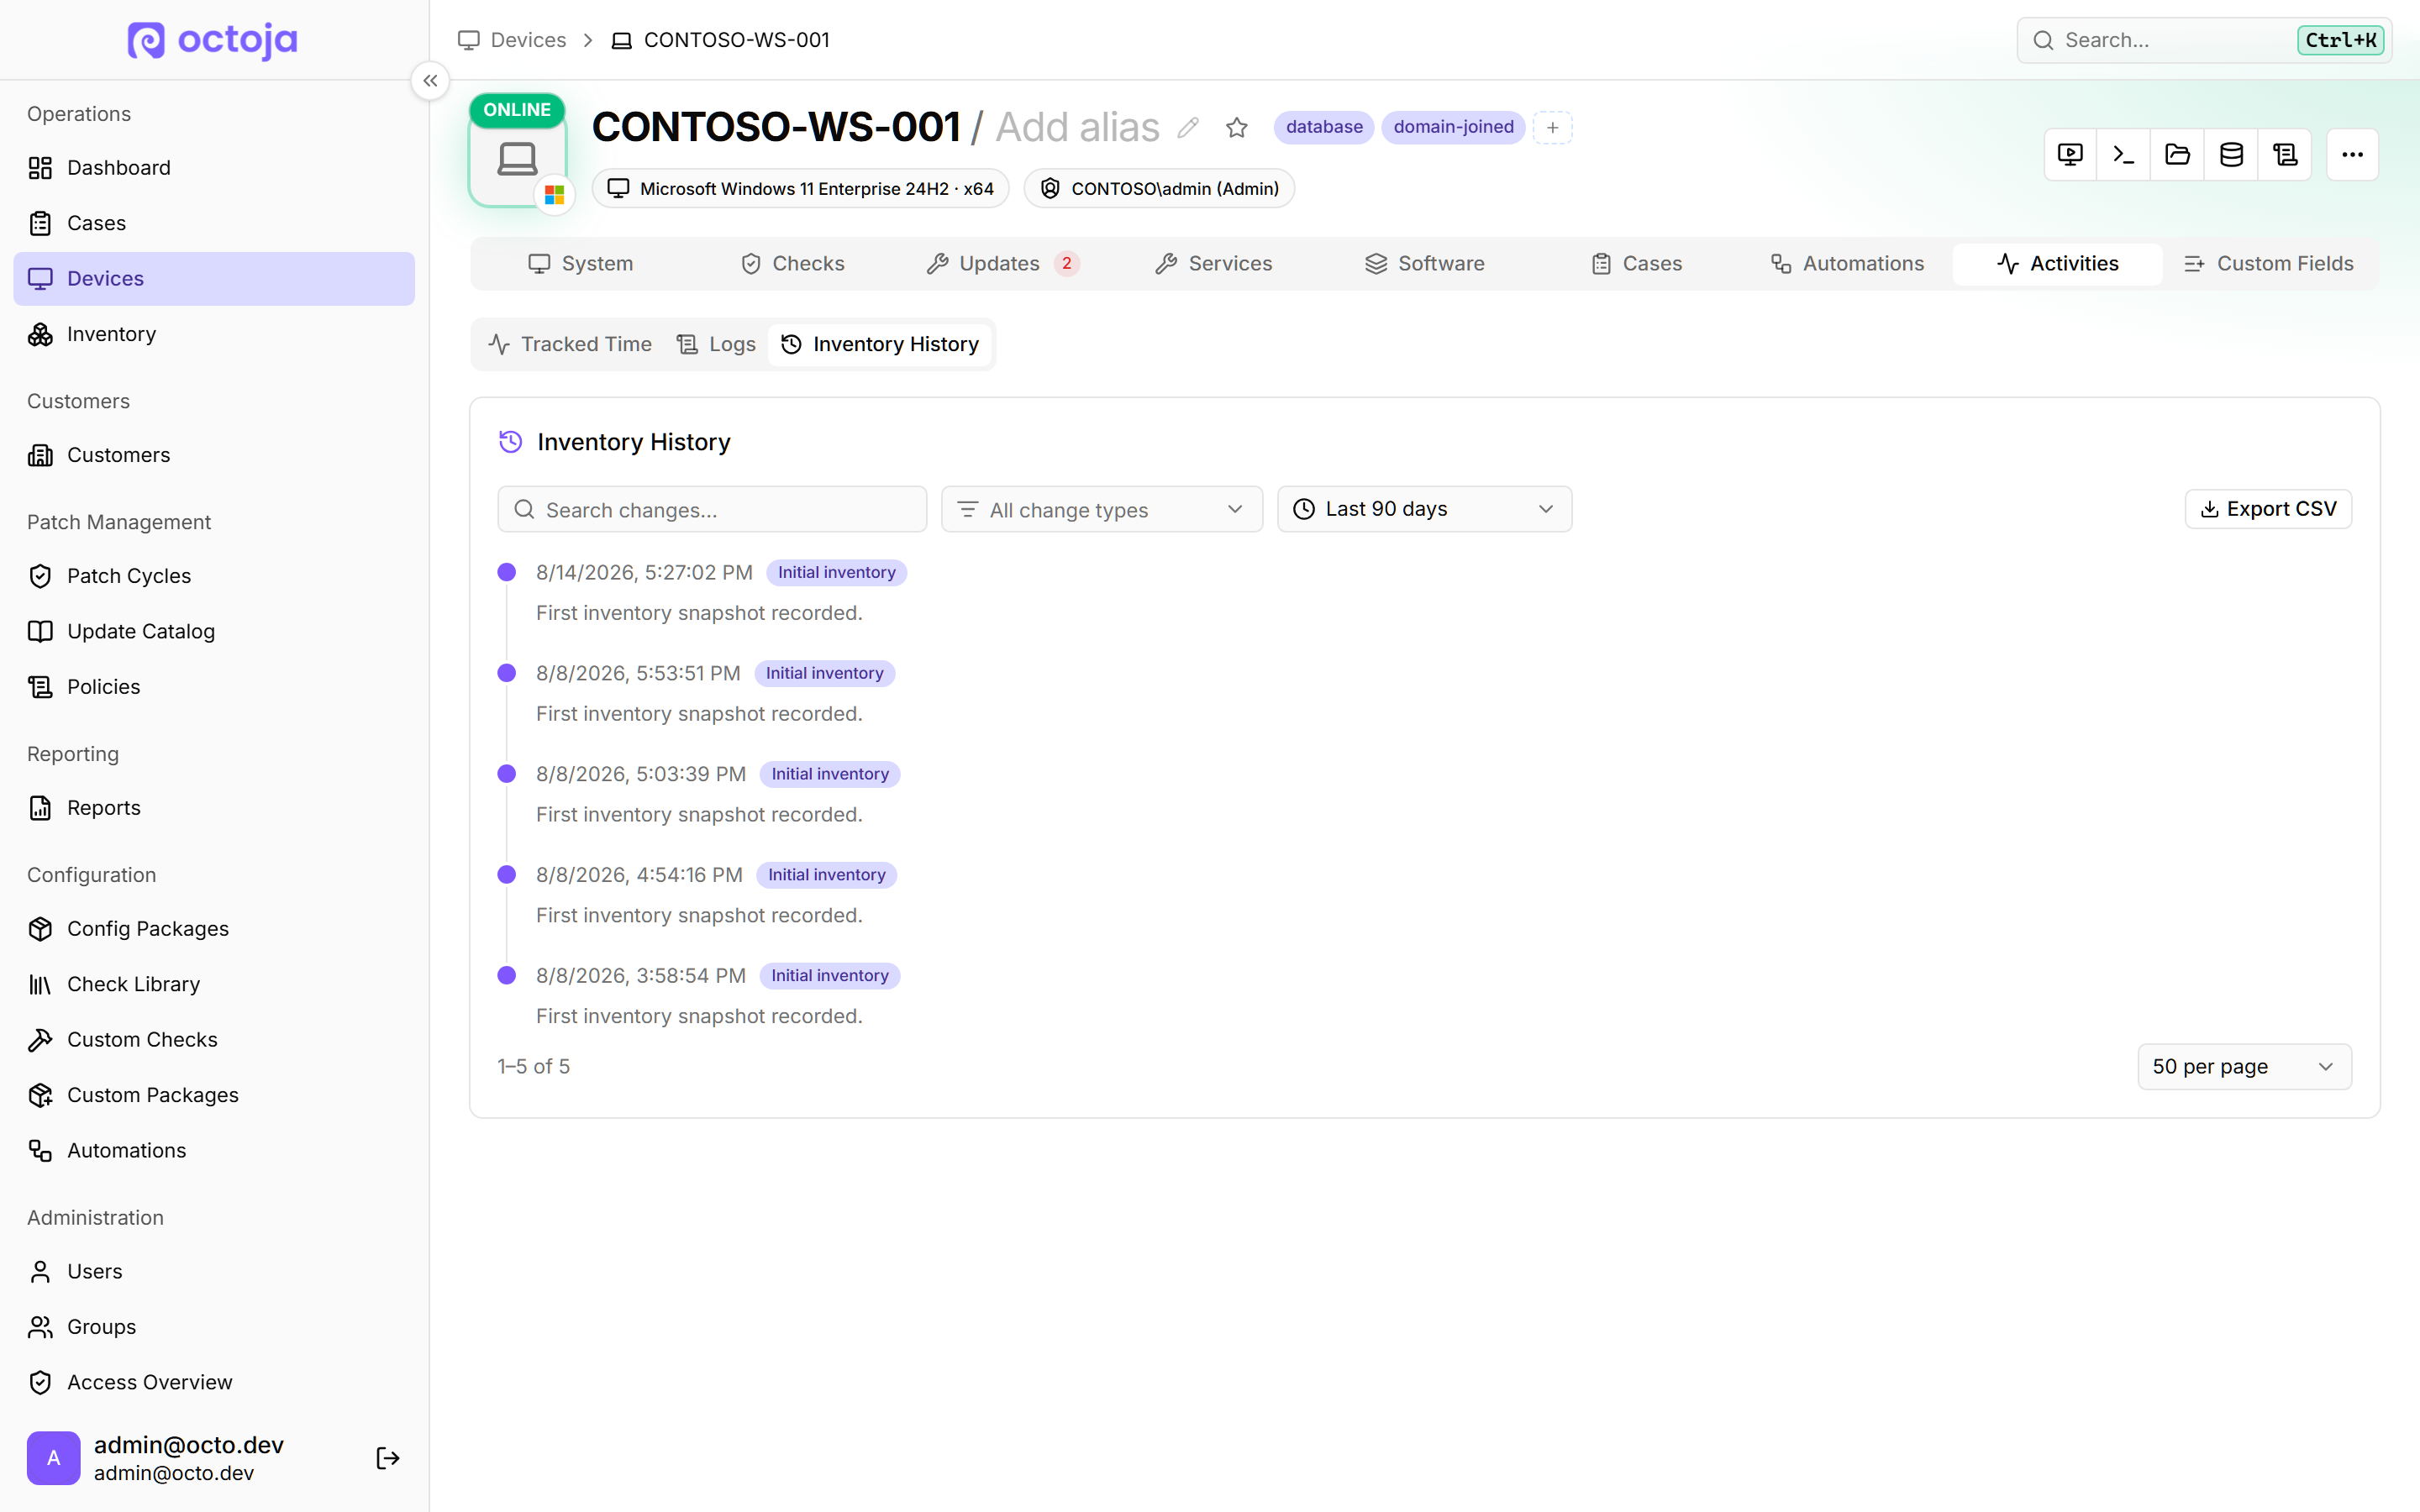
  • Tracked Time, Logs and Inventory History move under Activities — The device page now groups these into a single "Activities" tab with sub-tabs, and old links still open the matching sub-tab.
  • TANSS setup now takes a 2FA code and an ERP API token — "Set up TANSS" takes both from your TANSS configuration, and octoja keeps the session alive on its own.
  • Agent logs survive updates and include check diagnostics — "Download logs" now returns error output from monitoring checks and background tasks too.
  • Add your own parameters when creating or editing a package version — Define your own package parameters on any version of a custom package, not only while creating the package itself.
  • More config package templates: physical servers, Hyper-V and warranty — "Start from Template" on "Config Packages" now also offers "Physical Windows Server Add-on", "Hyper-V Host", "Hyper-V Virtual Machine", "Lenovo Warranty" and "Wortmann / TERRA Warranty".
  • Clearer reasons when a macOS update cannot be installed — A failed macOS update now shows the actual error, and updates that macOS will only install for a signed-in user are now listed as "Not Applicable" rather than "Failed".
  • Add network device preselects your customer and site — "Add network device" preselects the customer and site you filtered by, lists only that customer's devices in the "Monitoring" picker, and adds "IP Camera" as a device type.
  • Remote Desktop only appears on Windows devices — On Linux and macOS the entry led nowhere, so nothing is lost.
  • Customer and site lists appear in alphabetical order — Sites on the customer edit page and the integrations' site pickers, plus the customers list, now sort by name regardless of capitalisation.
  • Device tag rows adapt to the width instead of cutting off at three — A count badge opens the ones that don't fit.

Fixed

  • Built-in patch-policy templates with tag-based rings work again — A policy created from one used to produce no patch cycles at all.
  • Scheduled patch cycles no longer run twice, or repeat after a restart
  • Checks from a config package template now use their real defaults — Any setting a template leaves out now comes from the check's own defaults instead of falling back to zero.
  • A config package can no longer assign the same check twice
  • Windows devices report every pending update again — Update sources are now scanned in parallel with a 120-second per-source timeout, so a slow source is no longer dropped from the scan.
  • winget updates report a failure instead of a false success
  • Bitdefender GravityZone servers are no longer flagged as unprotected
  • Bitdefender and Securepoint checks stop reporting stale threats — Both now count only quarantine entries from the last 24 hours instead of the entire local vault, and the window is adjustable.
  • Rules match Sophos firewalls and other agentless devices — Rules filtering on "Manufacturer", "Model" or "Serial Number" now match agentless devices such as firewalls, switches and routers.
  • Automation installs no longer hang at "Running" — Software-install steps now run as background jobs that report back on completion, so the step shows its real outcome.
  • The TANSS integration now works against real TANSS servers — Requests now use the "/backend" prefix live servers serve under, and the beta integration was rebuilt and checked against a live instance.
  • Multi-language MSI installers import correctly
  • Windows and Mac devices report their real name — Windows names longer than 15 characters now report in full, and Macs keep their stable System Settings name instead of flipping to a generic "Mac".
  • Ubuntu 26 and newer Linux devices list their physical drives again
  • Firewall Status check stops warning about healthy Windows firewalls — The check now reads the firewall state from the Windows registry instead of a service-and-WMI query that collapsed every failure into the same warning.
  • ESET and Veeam checks name the real error instead of a false alert — A failed local query used to raise a critical alert whose empty health fields looked like protection was switched off.
  • SMTP, FTP, IMAP, POP3 and SSH checks show their results again
  • Failed runs show the right colour in a check's "History" view
  • A check you start by hand gets its full time limit — A manually started check now waits its full configured time limit, up to about an hour, instead of reporting a false failure after 30 seconds.
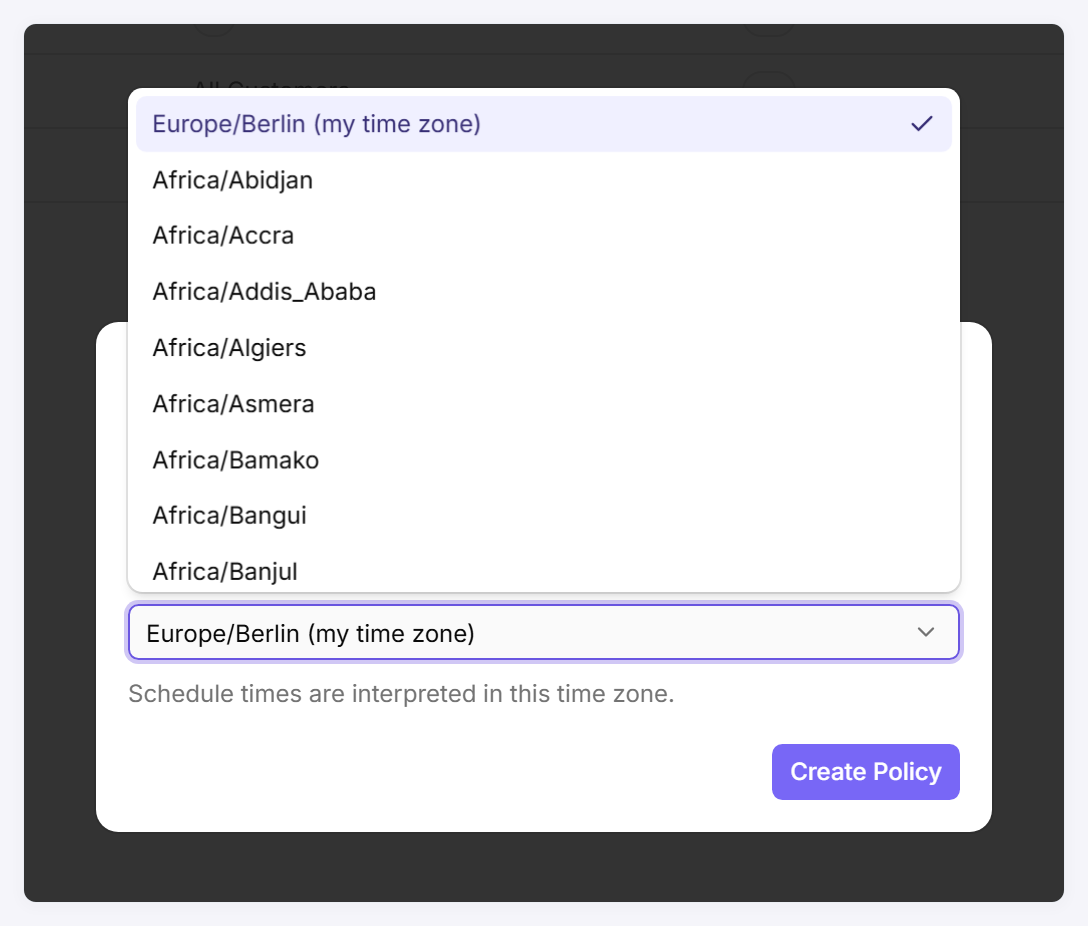
  • Scheduled reports run at the time you set — Reports now send in your instance's time zone instead of UTC.
  • FortiGate and Check Point firewall checks show their own settings — Picking FortiGate (SNMP) or Check Point (SNMP) as the "Vendor" now shows the settings that belong to them, including the SNMP community string and the v3 credential fields.
  • WatchGuard CPU readings are no longer pinned to 100%
  • QNAP NAS check no longer reports empty drive bays as "Critical"
  • Drives without SMART data now report "OK" instead of a warning
  • UniFi (SNMP) checks on large switches return results again
  • "Save" works when overriding a check on a network device
  • Rotated and portrait monitors on Windows display upright
  • Devices return to their original screen size after a session
  • Typing in PowerShell no longer inserts stray "@" characters
  • Remote sessions no longer drop when the session list refreshes
  • The on-screen notice names every connected technician — When several technicians connect to the same machine at once, the on-screen notice now lists all their names instead of only one.
  • TV View shows accurate, clearly coloured status — TV View no longer counts checks removed from their config package, tiles show green at zero, and "Servers offline" turns red when a server goes down.
  • Reuse one email, Teams or webhook target across alert channels — The same email recipient, Teams channel or webhook can now sit at both "Warning" and "Critical" and escalate independently.
  • Changing a check's alert settings no longer leaves alarms open forever — Detaching or changing a check's alert configuration now ends its open alarms and closes the linked PSA tickets, and a dialog warns you first how many active alarms that affects.
  • Automations no longer print literal placeholders for a missing customer — When a device has no customer assigned, customer and site values now render empty in generated Cases, Teams messages and webhooks instead of raw placeholder text.
  • "Run script" steps set to "Logged-in user" work on Windows again
  • The service list is complete again and the "Start Type" picker stays usable — The "Services" tab now lists everything the machine is currently reporting, and the "Start Type" dropdown stays open while you choose.
  • Long-offline devices no longer count toward your usage — Usage counts sent to octoja now include only devices seen in the last 90 days.
  • Account scope now hides "Add Customer" and "Import Customers" — These actions and clearing a customer now require access to every customer; limited accounts have the first two hidden and the third refused.
  • Autotask, HaloPSA and Lywand customer matching gains a usable menu — "Auto-match by name" and "Show only unmatched" have moved into the customer-matching dialog's "…" menu.
  • "Custom Domain" now shows the correct CNAME "Target" — The "Target" now comes from your instance's configured address instead of echoing whatever address you were browsing.
  • "Feedback portal" and "Help & docs" now open with you already signed in
  • "Kill process" confirmation stays open while the list refreshes
  • Dropping several files on a single-file upload area now warns you — Dropping more than one file now shows "Only one file can be uploaded at a time." instead of quietly keeping the first.

July 11th, 2026

New

Improved

Fixed

Highlights

This release widens what octoja can watch and makes big lists easier to live with. You can now monitor whole classes of equipment without installing an agent — network switches, routers and firewalls, VMware hosts, even FRITZ!Box gateways — and a broad wave of new checks covers databases, printers, backups, disks, network services and more. A new full-screen TV View puts your fleet's warnings, critical issues and offline servers on one board, while the device list gains bulk actions, optional columns and the same controls now shared by every list in the product. The rest is polish and reliability — steadier remote desktop, calmer inventory history, and a long tail of check-accuracy fixes.

New

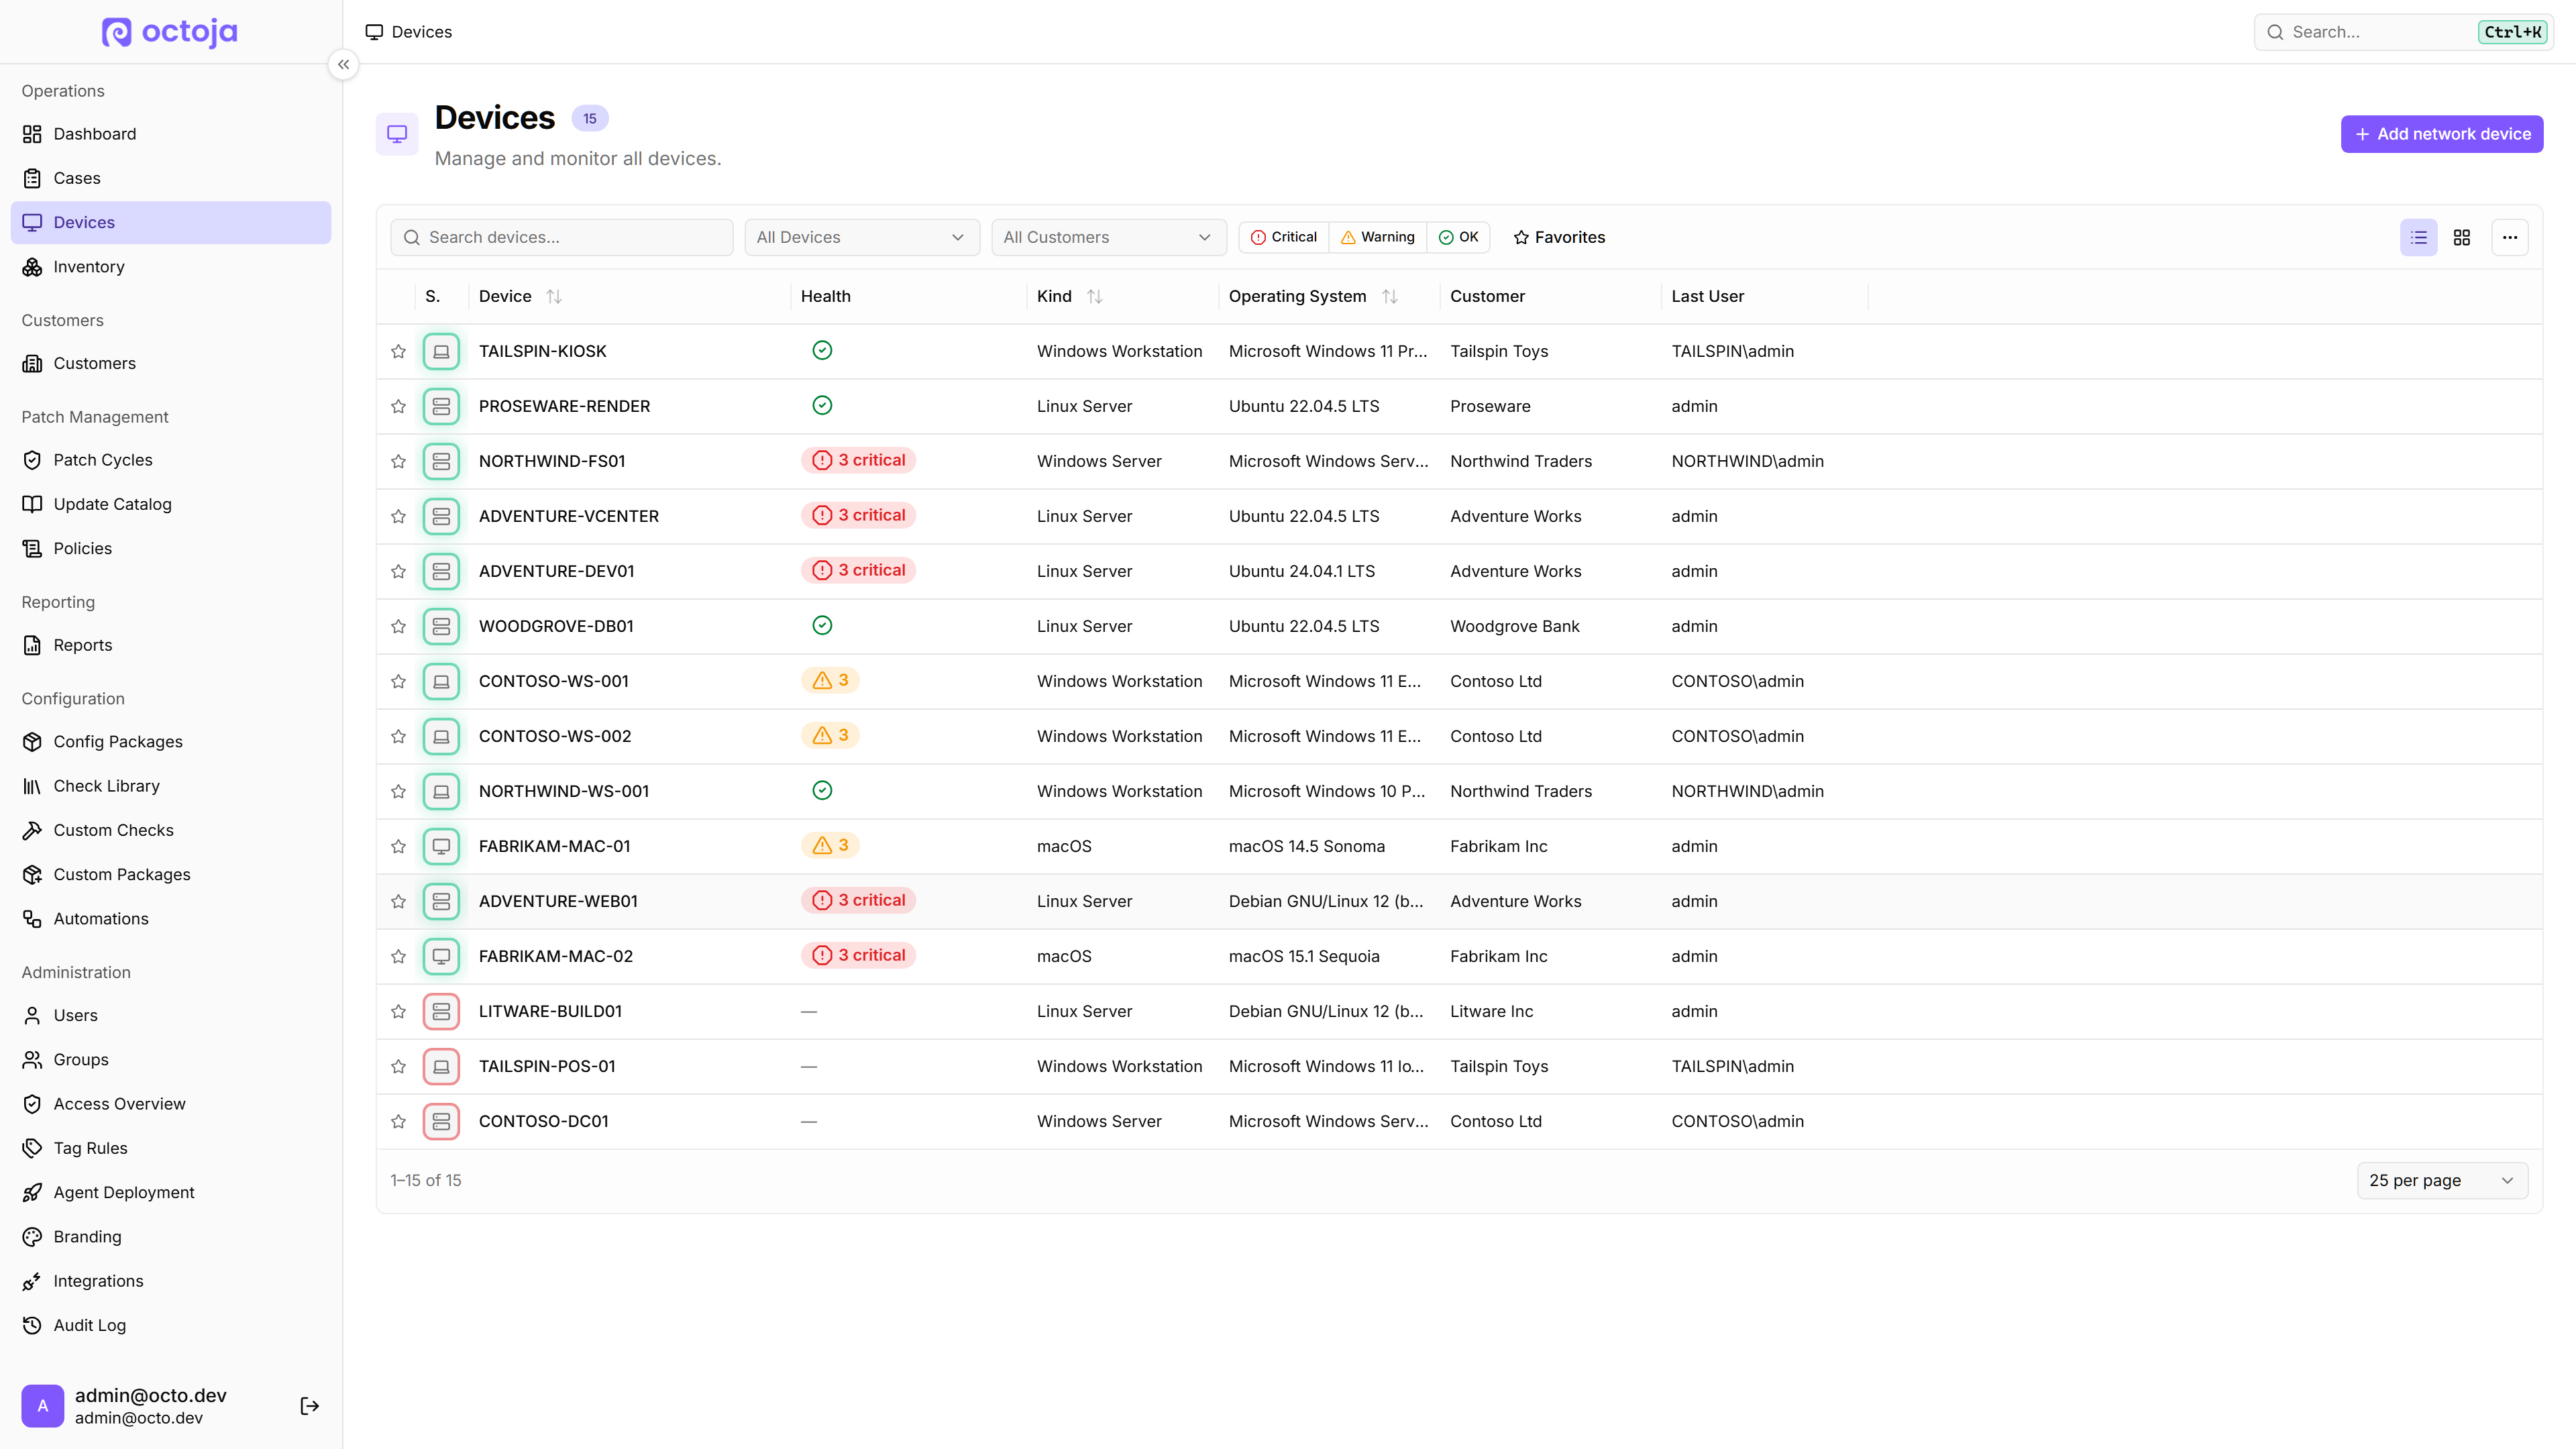
  • Monitor network devices without an agent — You can now add and monitor network devices — switches, routers, firewalls, printers and other agentless equipment — without installing an agent; a designated agent monitors them on your behalf. Each device offers SSH, SNMP and an experimental Web Console (open the device's web admin interface securely tunnelled through its monitoring agent) from its hover card and the command menu, shows its IP in device lists, and can be isolated with a new Network device-type filter on the dashboard.
    Monitor network devices without an agent
  • Manage VMware ESXi and vCenter — You can now add VMware ESXi hosts and vCenter servers as agentless devices and manage them from octoja: live host CPU, memory and performance metrics, virtual-machine inventory, datastores, and power control to start or stop VMs. A Test connection button lets you verify host access before saving.
  • Monitor FRITZ!Box-class internet gateways without SNMP — octoja can now inventory FRITZ!Box-style internet gateways over TR-064 when SNMP isn't available, pulling device details directly from the gateway. The add/edit network-device form gains Test connection buttons for both SNMP and TR-064 so you can confirm access before saving.
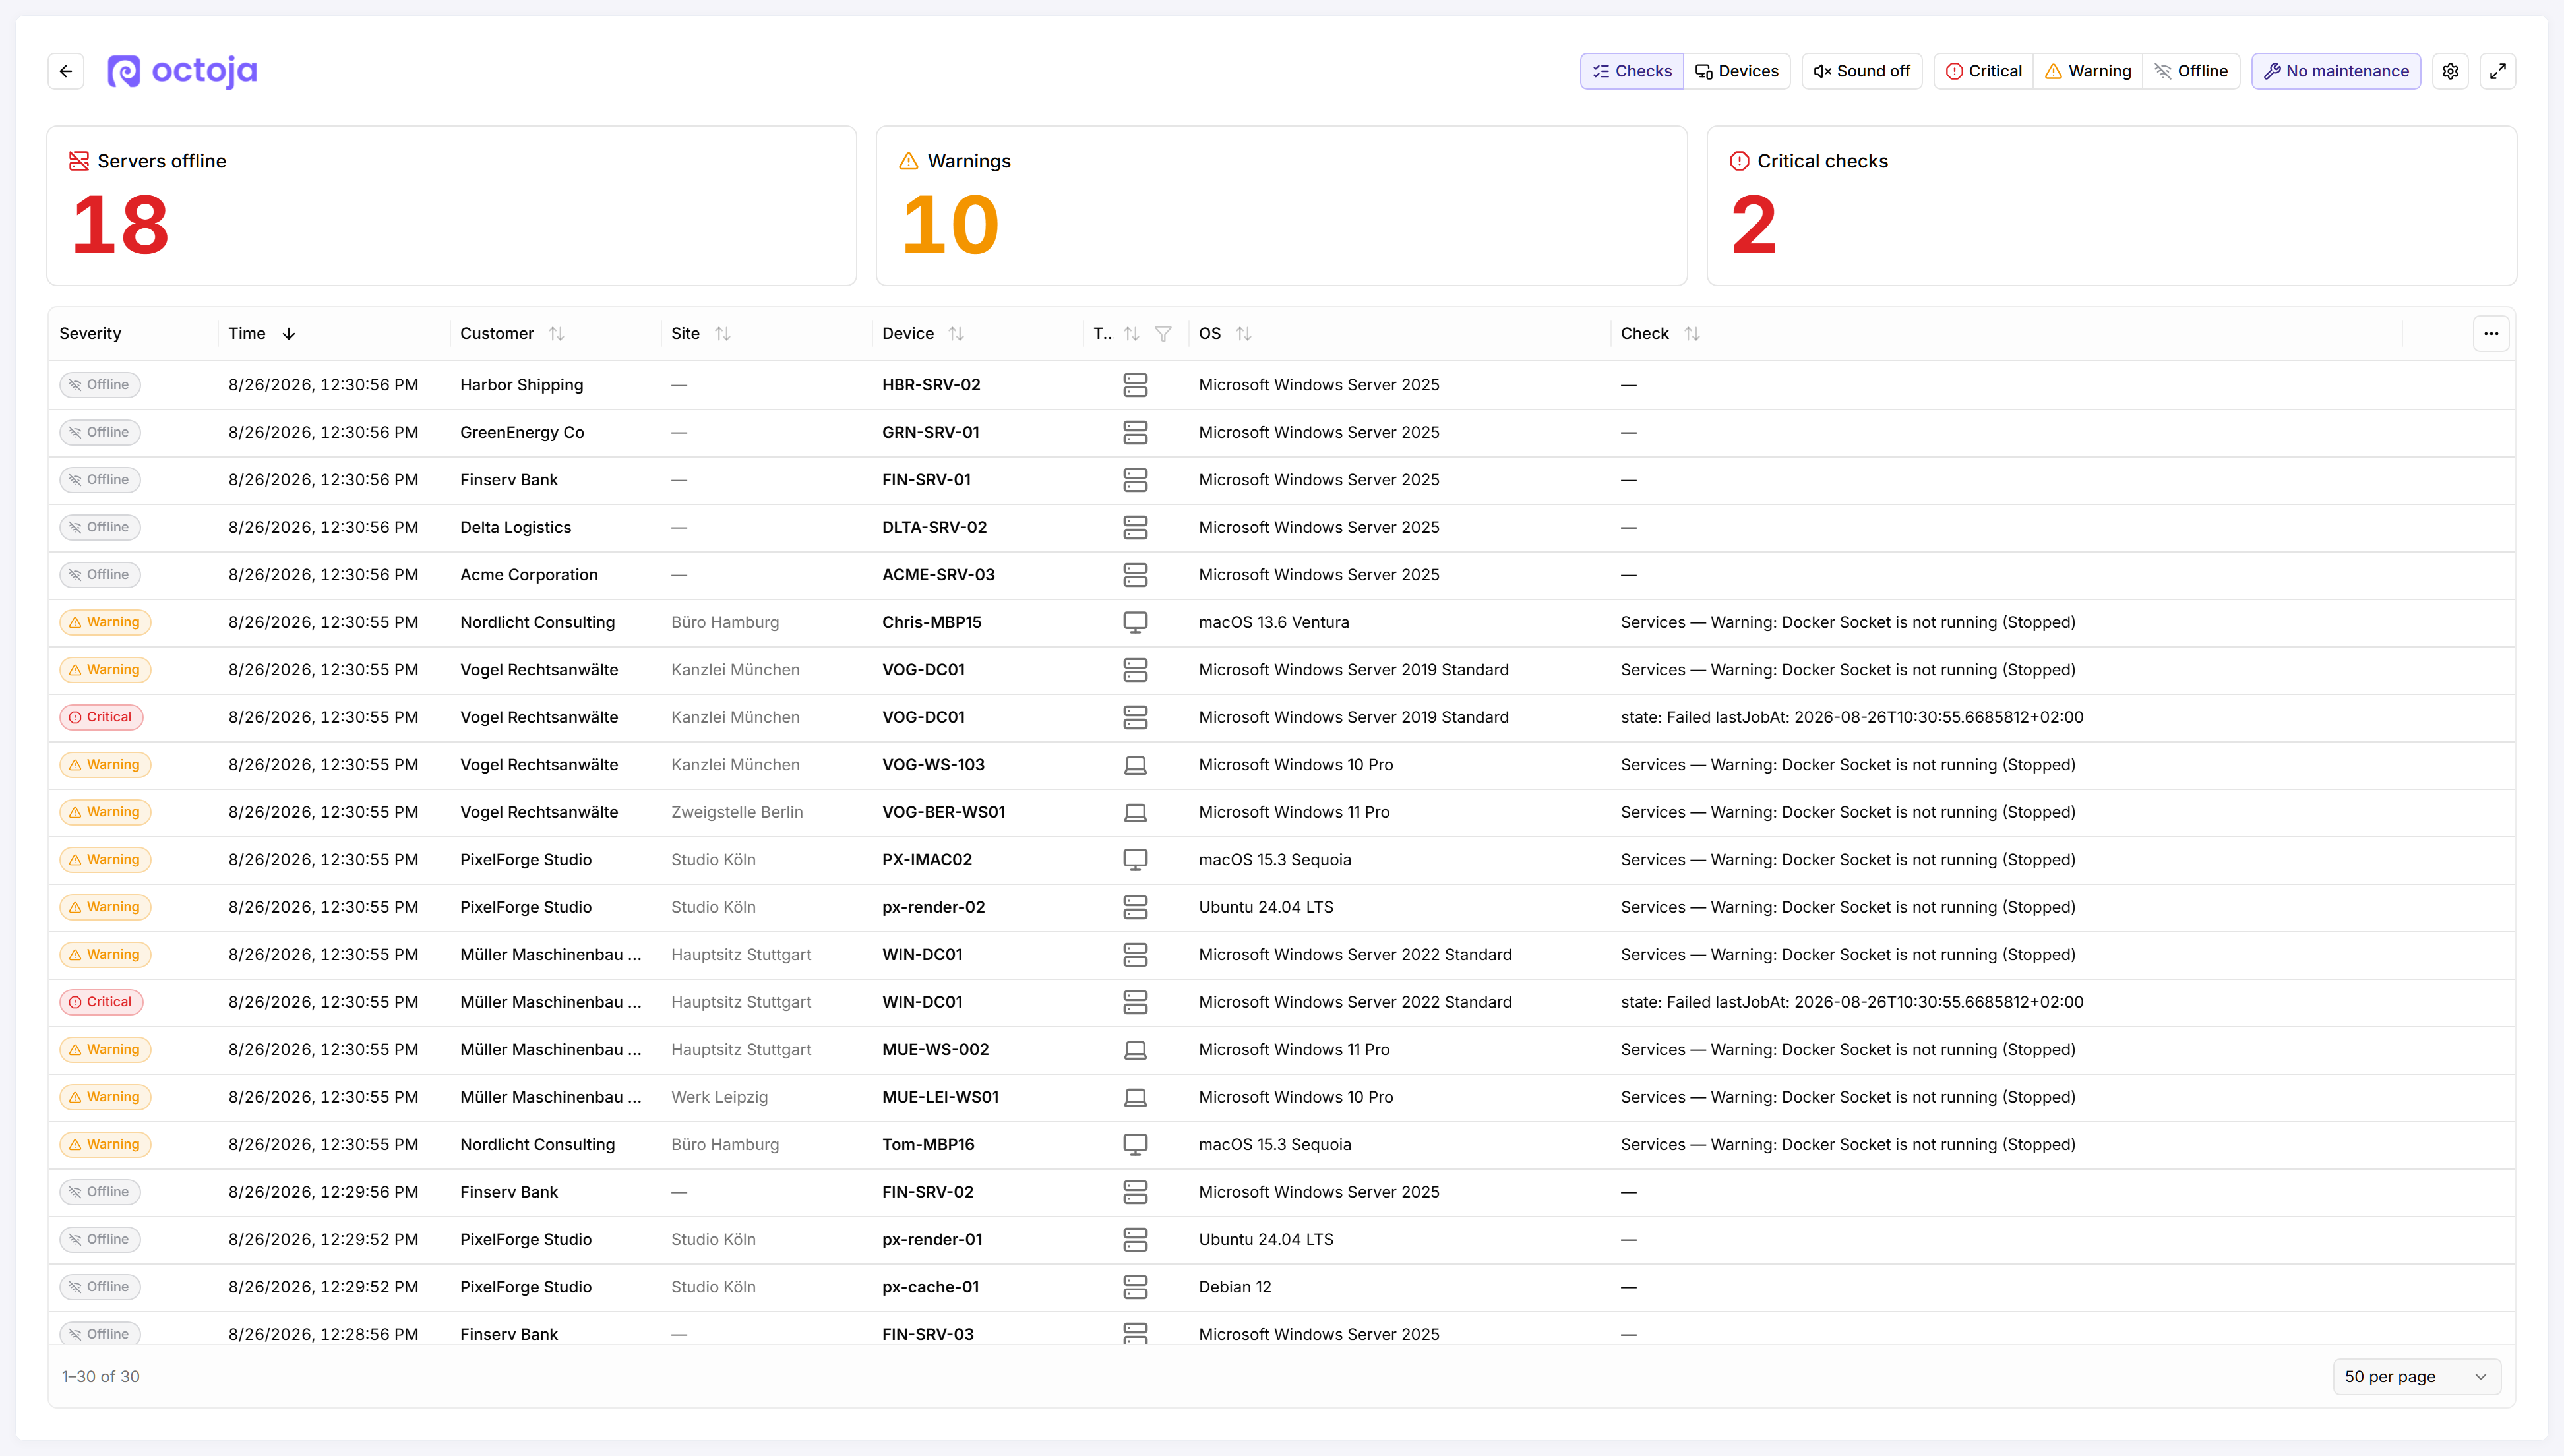
  • New TV View for live fleet status — The new TV View puts your fleet's active warnings, critical issues and offline servers on a full-screen board — colour-coded tiles above a sortable, filterable table whose rows link straight to the device. New issues flash briefly as they arrive and can play a configurable alert sound when a critical issue appears or a server goes offline, and the list scrolls while the header, tiles and pagination stay pinned. It auto-refreshes and is gated behind its own permission.
    New TV View for live fleet status
  • New database monitoring checks — You can now monitor your database servers. Microsoft SQL Server gets a Health check (service and connectivity, database status, backup age, disk space, failed Agent jobs, Always On) and an Activity check (blocking sessions and severe error-log entries), while PostgreSQL and MySQL/MariaDB each get a health check (reachability, response time, active sessions, size/uptime) plus a check that runs your own read-only query and alerts on its row count or run time. Query checks run read-only, so they can never change your data.
  • New printer monitoring checks — You can now monitor printers three ways: a network-printer check over SNMP (v2c and v3) reports status, remaining toner and consumable levels and the lifetime printed-page count; a local-printer check watches Windows-installed printers for error states (out of paper or toner, jams, offline, service required); and a print-queue check for print servers alerts on offline printers, errored or blocked jobs, or a backed-up queue.
  • New disk and storage monitoring checks — Several new checks watch disks and storage. Disk Presence tracks the physical disks in a device and alerts when one is removed, reporting serial and model (external/USB drives ignored by default). Others verify BitLocker encryption on fixed drives, flag a volume scheduled for a chkdsk repair at next boot, measure disk fragmentation (SSDs excluded), watch free space on folder-mounted volumes that ordinary disk checks overlook, and report Windows Storage Spaces pool and virtual-disk health.
    New disk and storage monitoring checks
  • New backup monitoring checks — New checks keep an eye on backups. A Xopero ONE check watches the Backup & Recovery Agent on Windows, Linux and macOS, flagging failed or overdue backups and naming the affected plan; two TERRA CLOUD checks cover backup job status (result, age, error/warning counts, ransomware-detection state) and satellite replication health; and a shadow-copy writer check flags problems with the Windows Volume Shadow Copy writers backups rely on — an early warning of backup failures.
  • New network and internet service checks — A family of new checks watches network services by connecting to them and alerting when one is unreachable, times out or responds incorrectly: SMTP, IMAP and POP3 mail servers, FTP and SSH servers, and a TCP port check for any host and port. A DNS check resolves hostnames and alerts on failures, slow lookups or unexpected addresses, and a domain-expiry check warns before a domain registration lapses. Most are cross-platform and let you require a specific response banner.
  • New Windows Server infrastructure checks — New checks cover Windows Server roles: DFS Replication backlog between two members, DHCP scope utilization (how full each address pool is), WSUS health (last sync result and age plus managed-computer compliance — how many have update errors, still need updates, or have stopped reporting), and network-adapter team health (degraded or down teams, with active member count).
  • New Windows system and activity checks — New checks report on day-to-day system state: system uptime (cross-platform, to catch missed reboots), whether a machine is waiting for a reboot and why, named Task Scheduler tasks that failed or were disabled, the health of the Windows Update agent itself, active and disconnected terminal/RDP sessions, and who is interactively logged on (with modes to warn when someone is or isn't present).
  • New custom and advanced metric checks — For monitoring beyond the built-in checks, you can now run a read-only WMI query, sample any Windows performance counter, watch a specific process's CPU usage across all cores, count files in a folder (too many for a stuck spool, too few for missing output), check whether specific files or folders are present or absent, and monitor Microsoft Message Queue depth — each alerting on your own thresholds.
  • New security monitoring checks — Two new Windows checks help you spot attacks and misconfiguration: a failed-logon check counts failed sign-in attempts over a window you choose and alerts when the volume looks like a brute-force attempt, and an AppLocker check counts blocked-application events (optionally including audit-mode) so you notice when software is being blocked or policies are wrong.
  • New change-detection monitoring checks — New stateful checks alert you when something you're watching changes: the contents of files or folders, Windows registry values (useful for autorun and security-policy keys), or file/folder access permissions on Windows and Unix. Each offers an “accept current” option to acknowledge an expected change and reset the baseline, so you're only alerted on the next one.
  • Lenovo hardware warranty monitoring — You can now monitor Lenovo hardware warranty expiry. A new check reads the device's serial number, looks up the warranty end date and warns you a configurable number of days before it expires. It uses the latest end date across base, extended and contract coverage, so purchased extensions are not reported as already expired, and warranty dates delivered in different formats now render correctly.
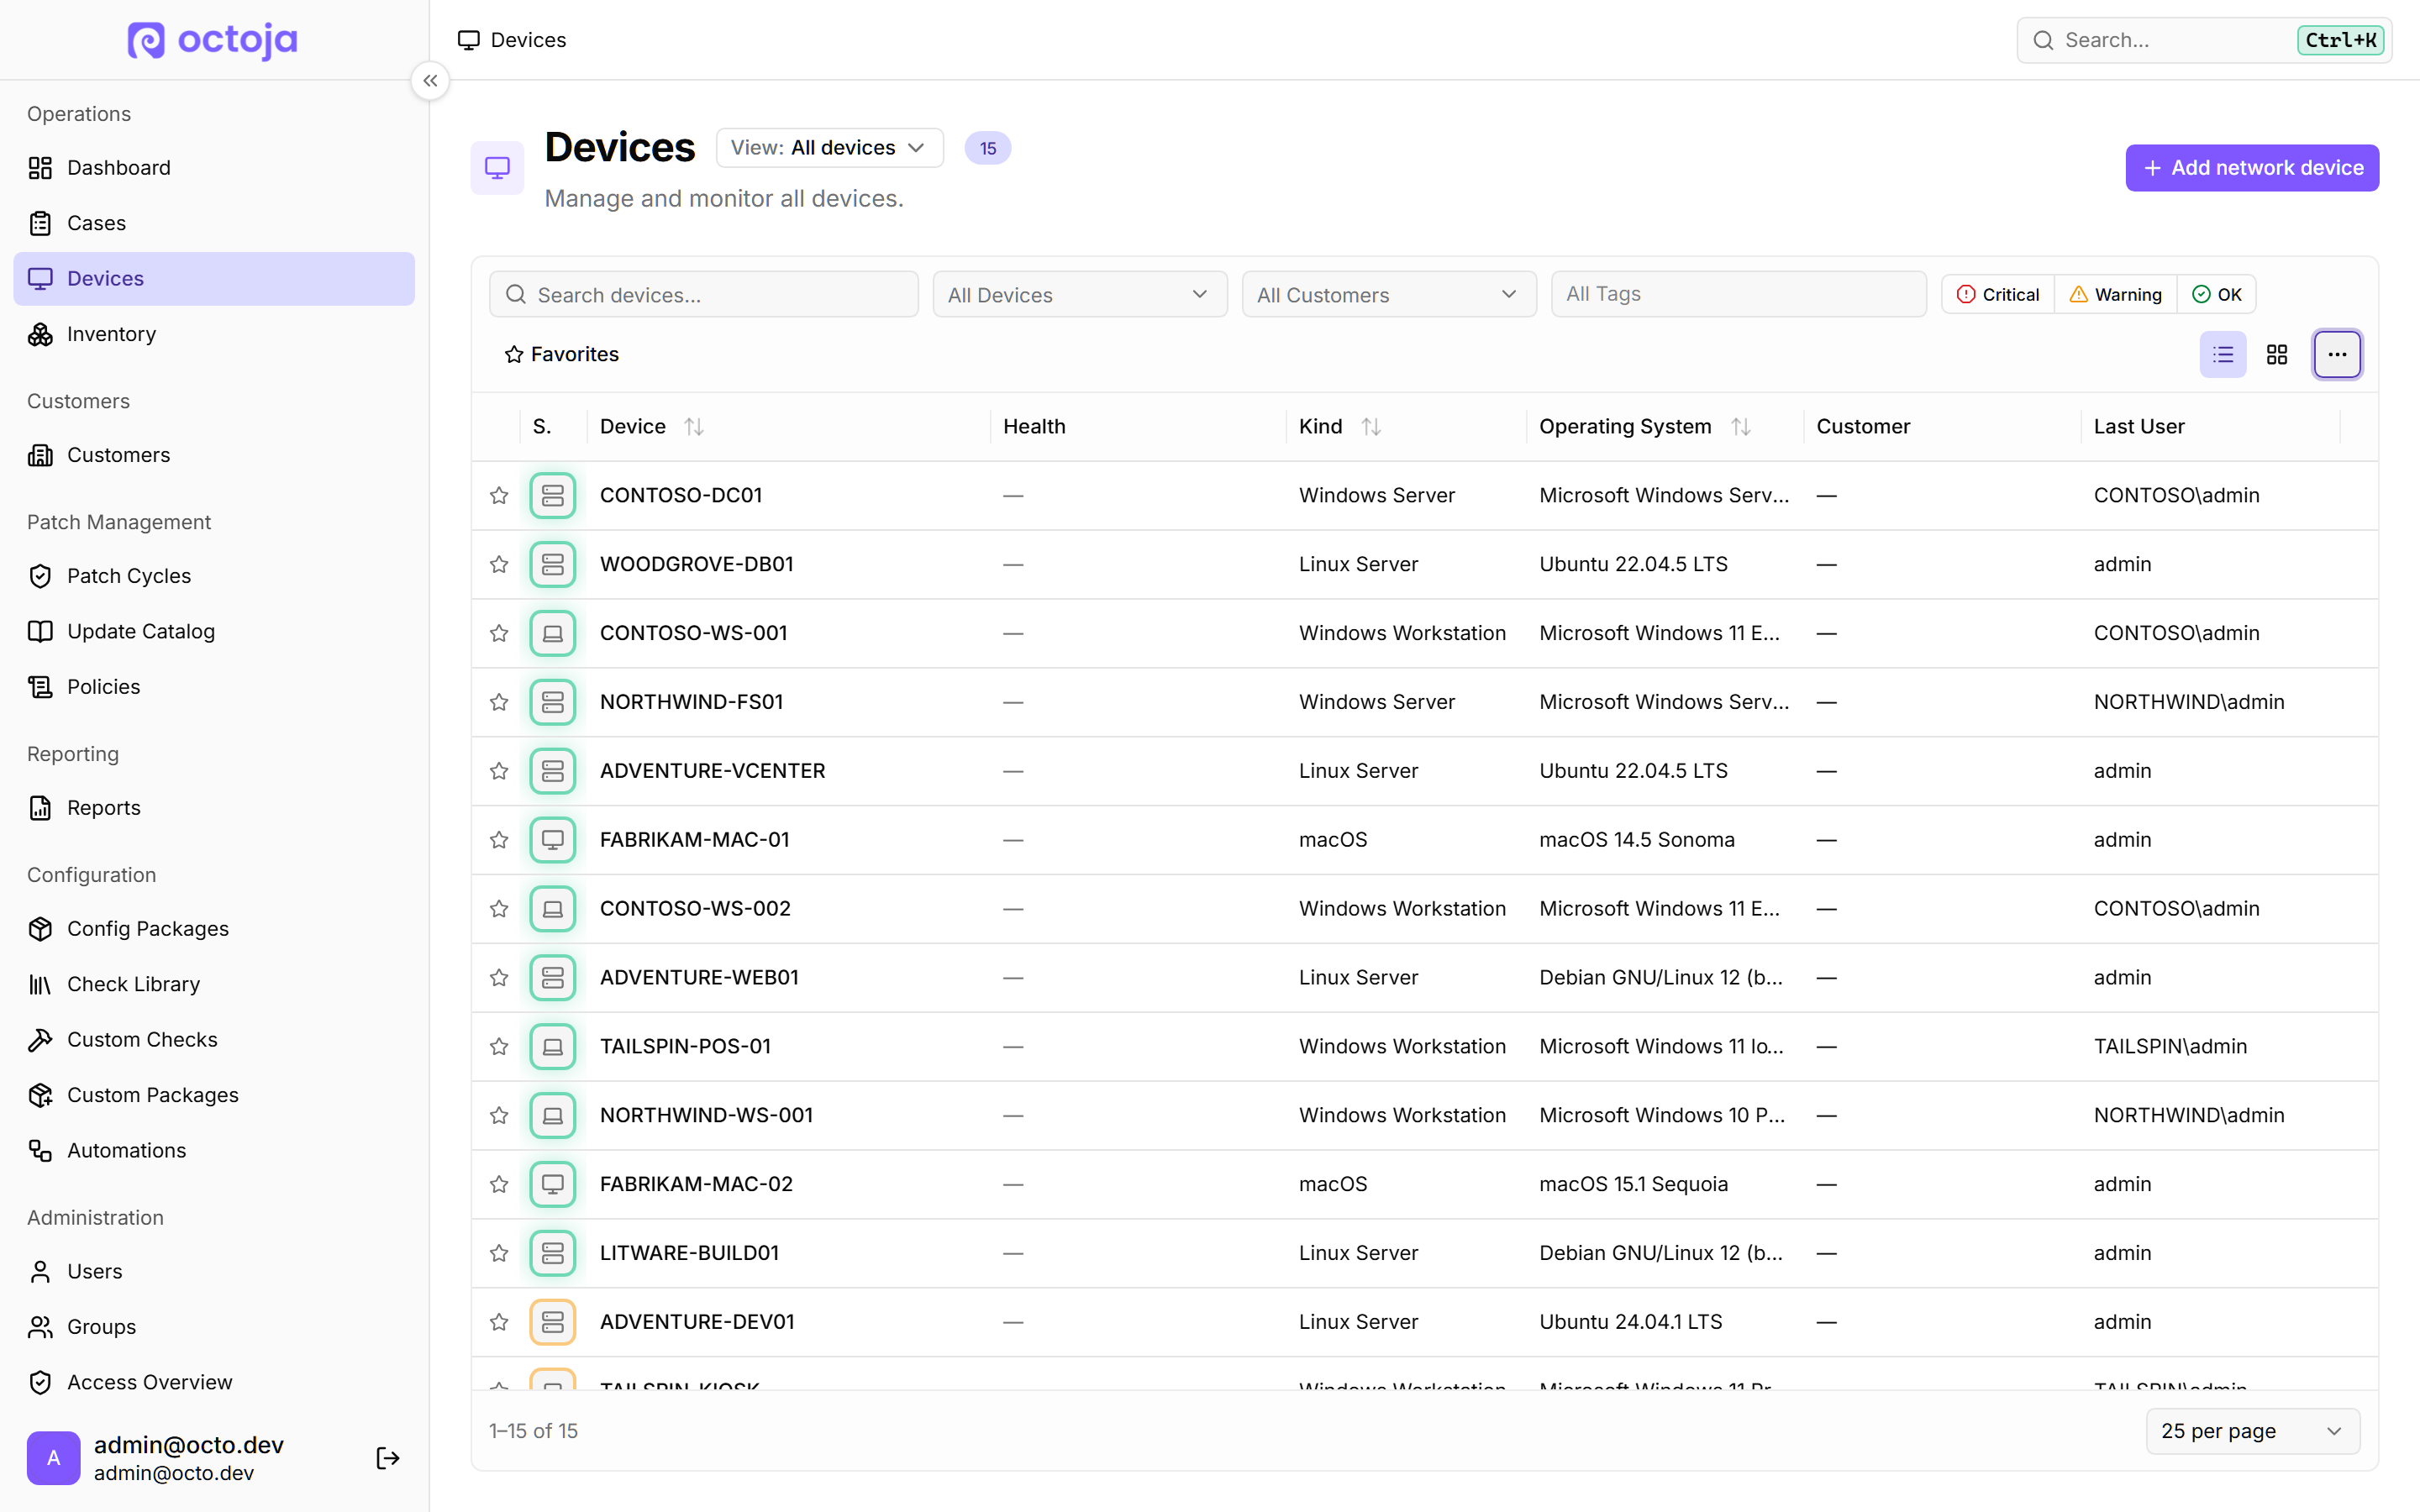
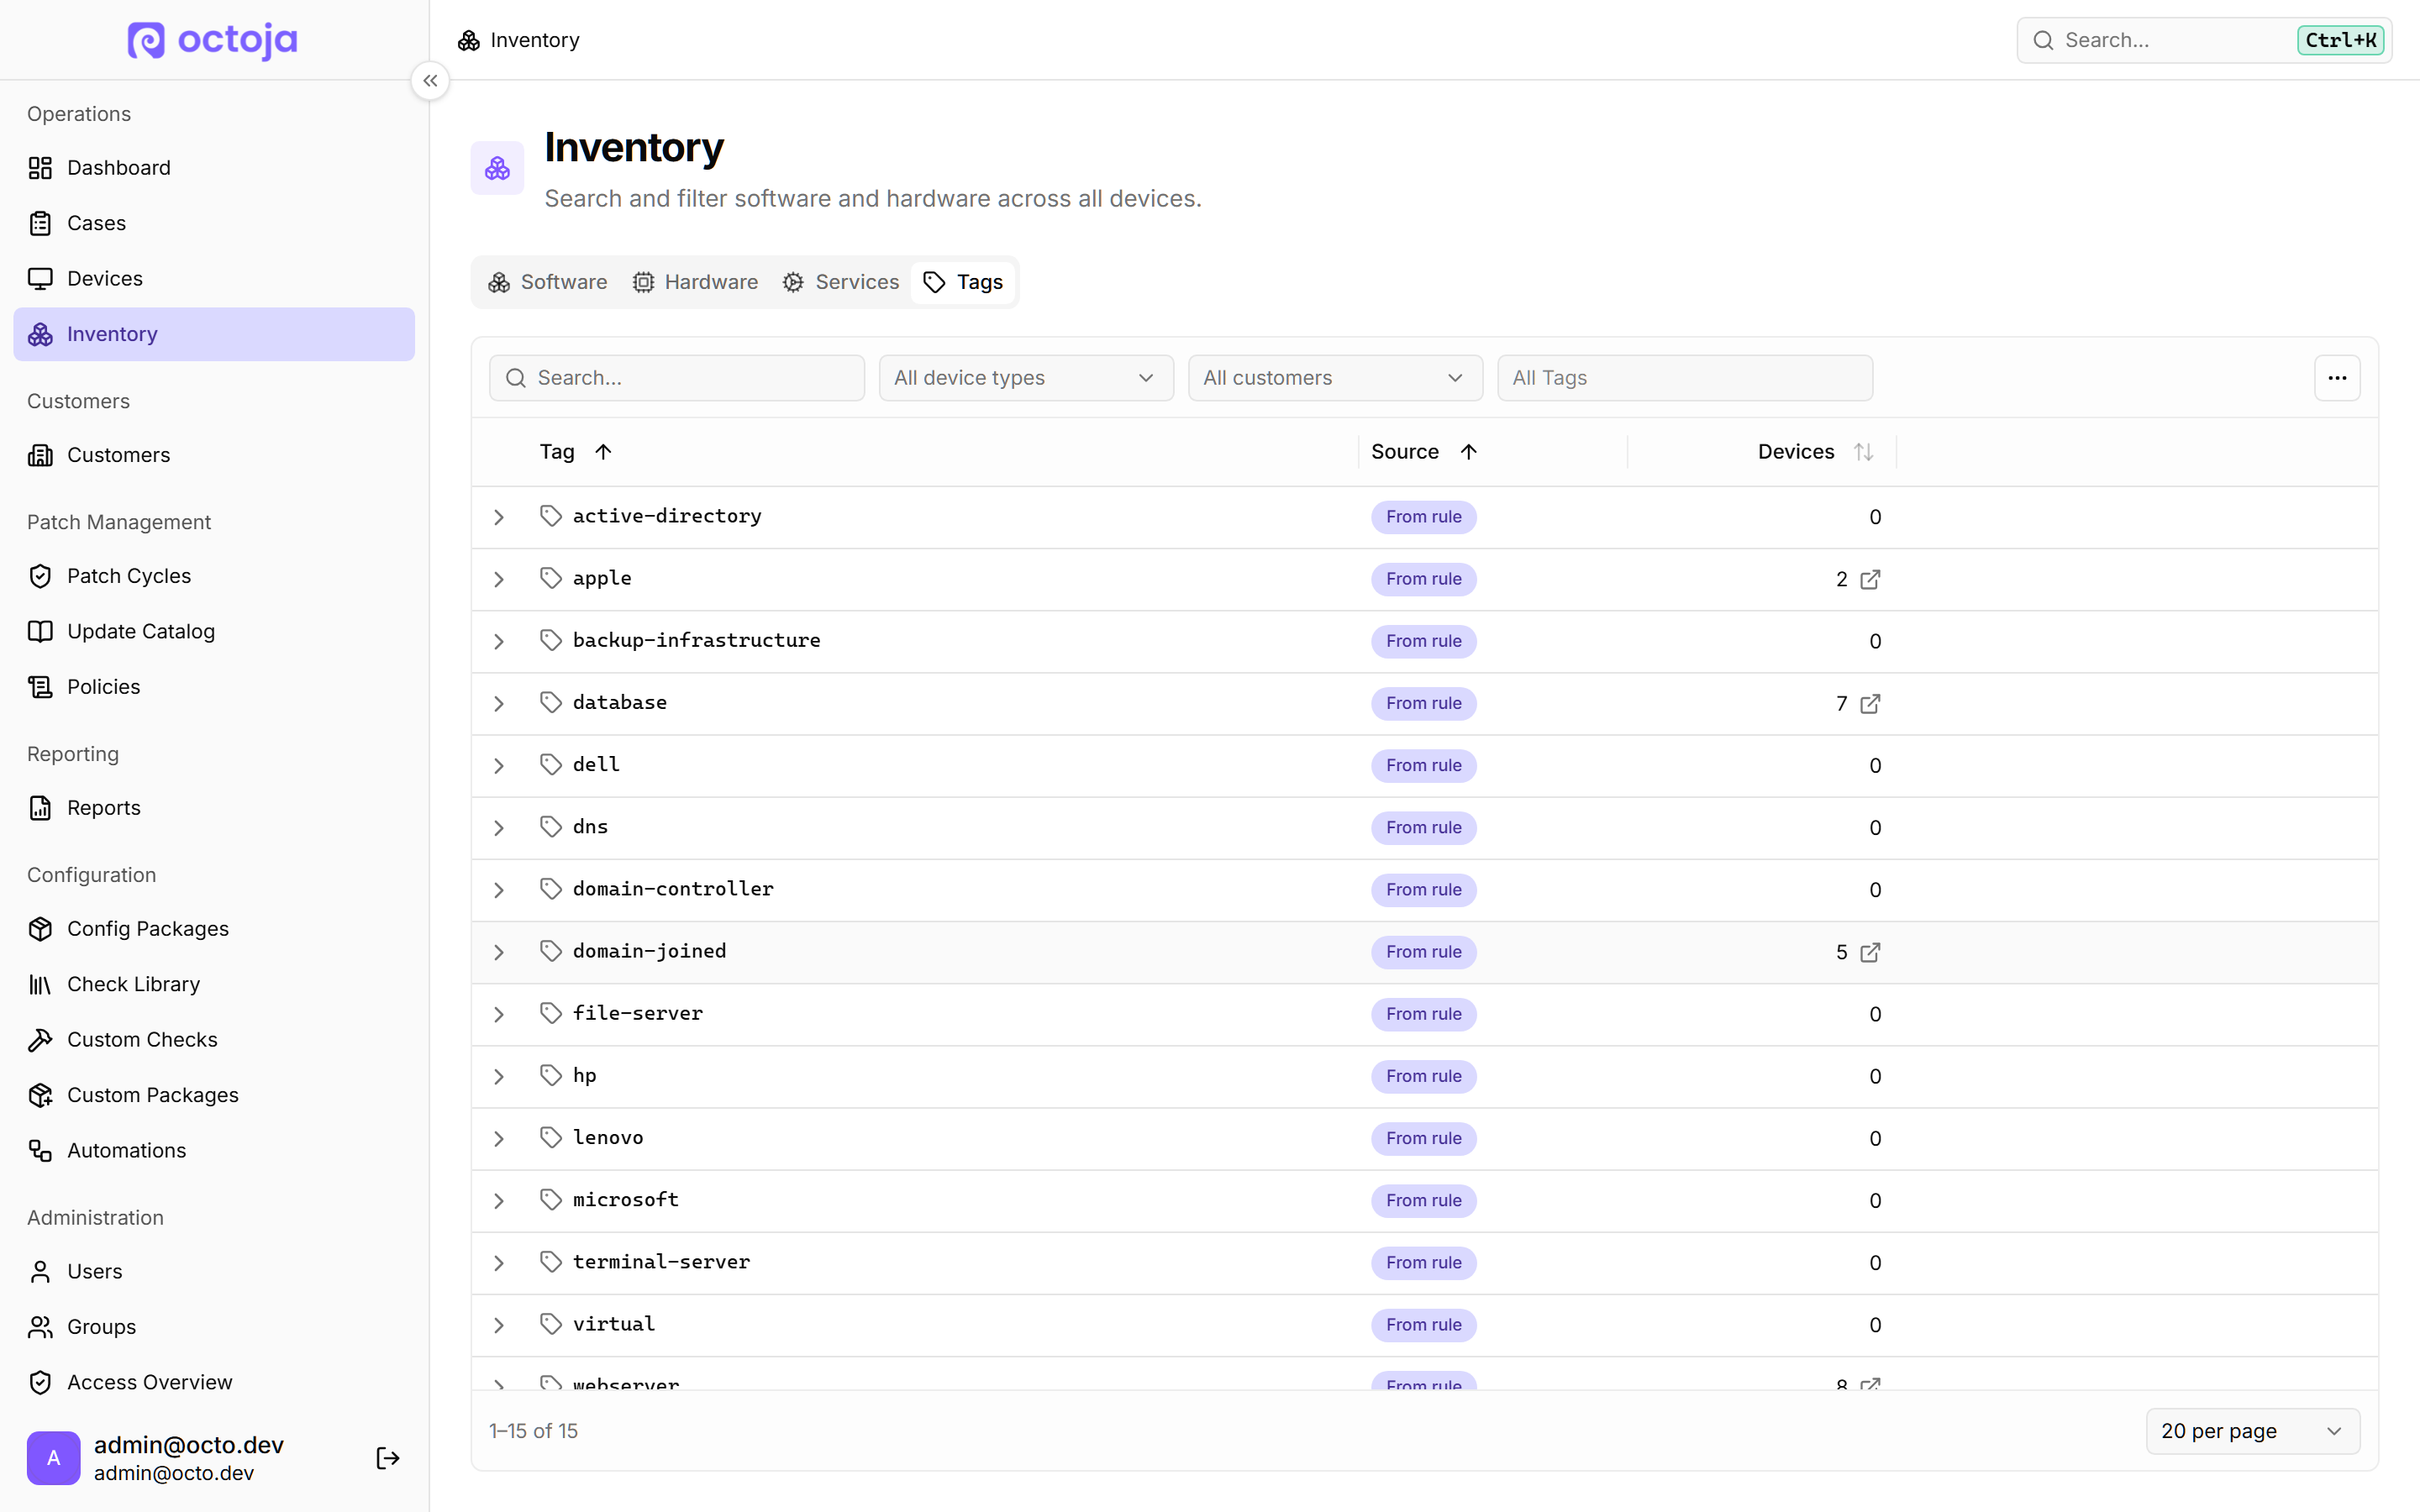
  • Bulk actions on the device list — Turn on Multiselect from the device list's menu to pick several devices at once, then assign them all to a customer or assign tags in a single action from a floating selection bar. Devices you aren't allowed to edit can't be selected.
  • See and undo per-device check overrides in config packages — The Checks tab of a config package now flags how many devices have drifted from the package with an overrides badge on each check. Open it to see which devices changed a check — disabled it, or overrode its inputs or alert thresholds — compare their settings against the package, and pull a single device or every drifted device back to the package config in one step.
  • Change service startup type from the Services tab — On a device's live Services tab you can now change a service's startup type between Automatic, Manual and Disabled, alongside starting and stopping it. Available on Windows devices when you have permission to control services.
  • Read-only access to the customers area — You can now give technicians read-only access to the customers area with a new view permission, separate from the permission to create or edit customers. Previously the whole area required manage access, so technicians without it saw nothing; on upgrade, existing users who could manage customers keep their access automatically.
  • Let users postpone a patch restart — When installing patches needs a reboot, the person signed in to the device can now be prompted to delay the restart a limited number of times before it goes ahead. You set how many times they can defer and how long each delay lasts per patch-policy ring, and the countdown survives a routine agent restart. Off by default.
  • Lock down the Windows Update interface from a patch policy — A new patch-policy option lets you disable the Windows Update interface on managed Windows devices. When turned on, the Windows Update settings page is hidden and manual scans and installs are blocked, so users can't patch outside your policy; it applies only while the policy owns the maintenance window and reverts automatically afterward.
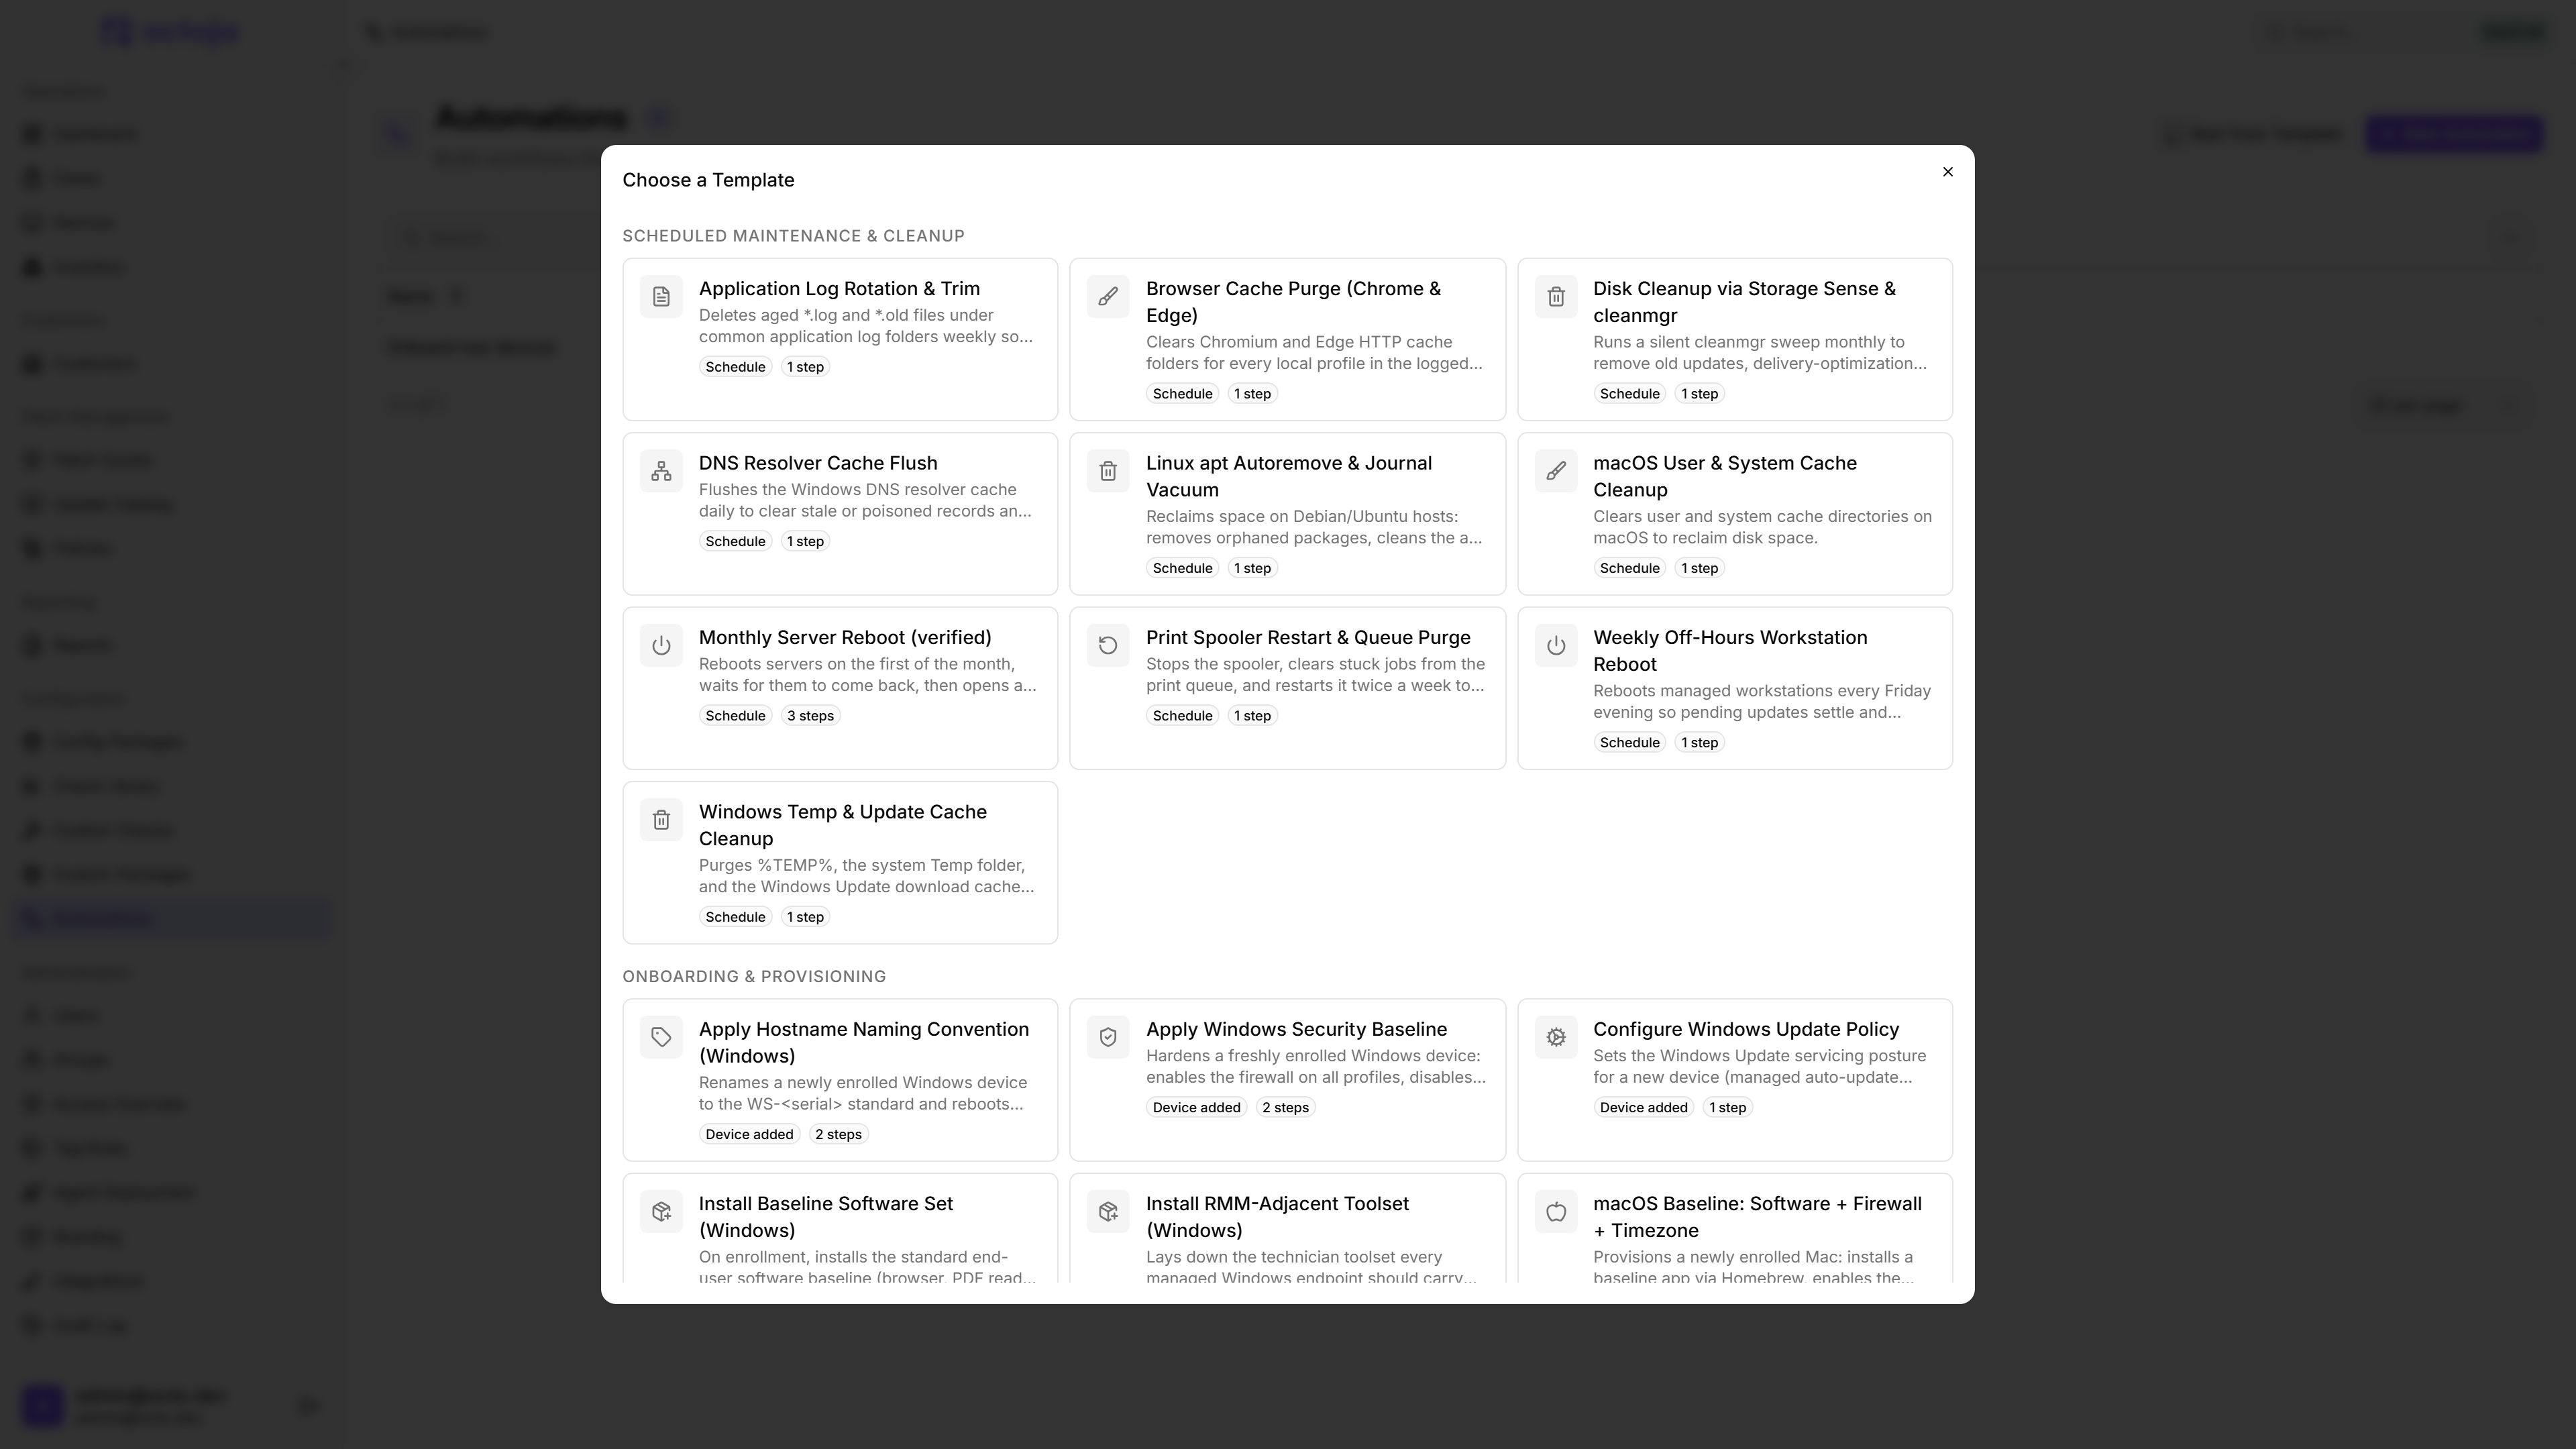
  • Ready-made templates for patch policies and automations — Creating a patch policy or an automation is faster with built-in starter templates. Pick from ten curated patch policies (staged rollouts, rapid deployment, compliance, servers) or thirty automation templates (device onboarding, scheduled maintenance, software hygiene) and clone one as your starting point instead of building from scratch.
    Ready-made templates for patch policies and automations
  • New "Ensure Lywand agent" automation action — You can add an “Ensure Lywand agent” step to an automation that checks whether the Lywand security agent is installed on a Windows device and silently installs it if it's missing, using the customer's matched Lywand license. If the install fails, the run records the underlying installer error so you can see why.
  • New automation step: add or remove a tag — Automations can now add or remove a tag on a device as part of a run. A condition on the step decides whether to add or remove, so one automation can tag the devices that match a rule and untag the ones that don't. Only tags you manage are touched, not ones derived automatically from inventory.

Improved

  • Consistent, more capable lists across octoja — Every list in octoja — devices, Cases, patches, customers, reports, admin and the device-detail tabs — now shares the same controls: resize, reorder and hide columns, search from the toolbar, and export the full list (not just the current page) to CSV. Many lists can also switch to a card view, and the device-detail Tracked Time, Updates and Cases tables are now searchable.
    Consistent, more capable lists across octoja
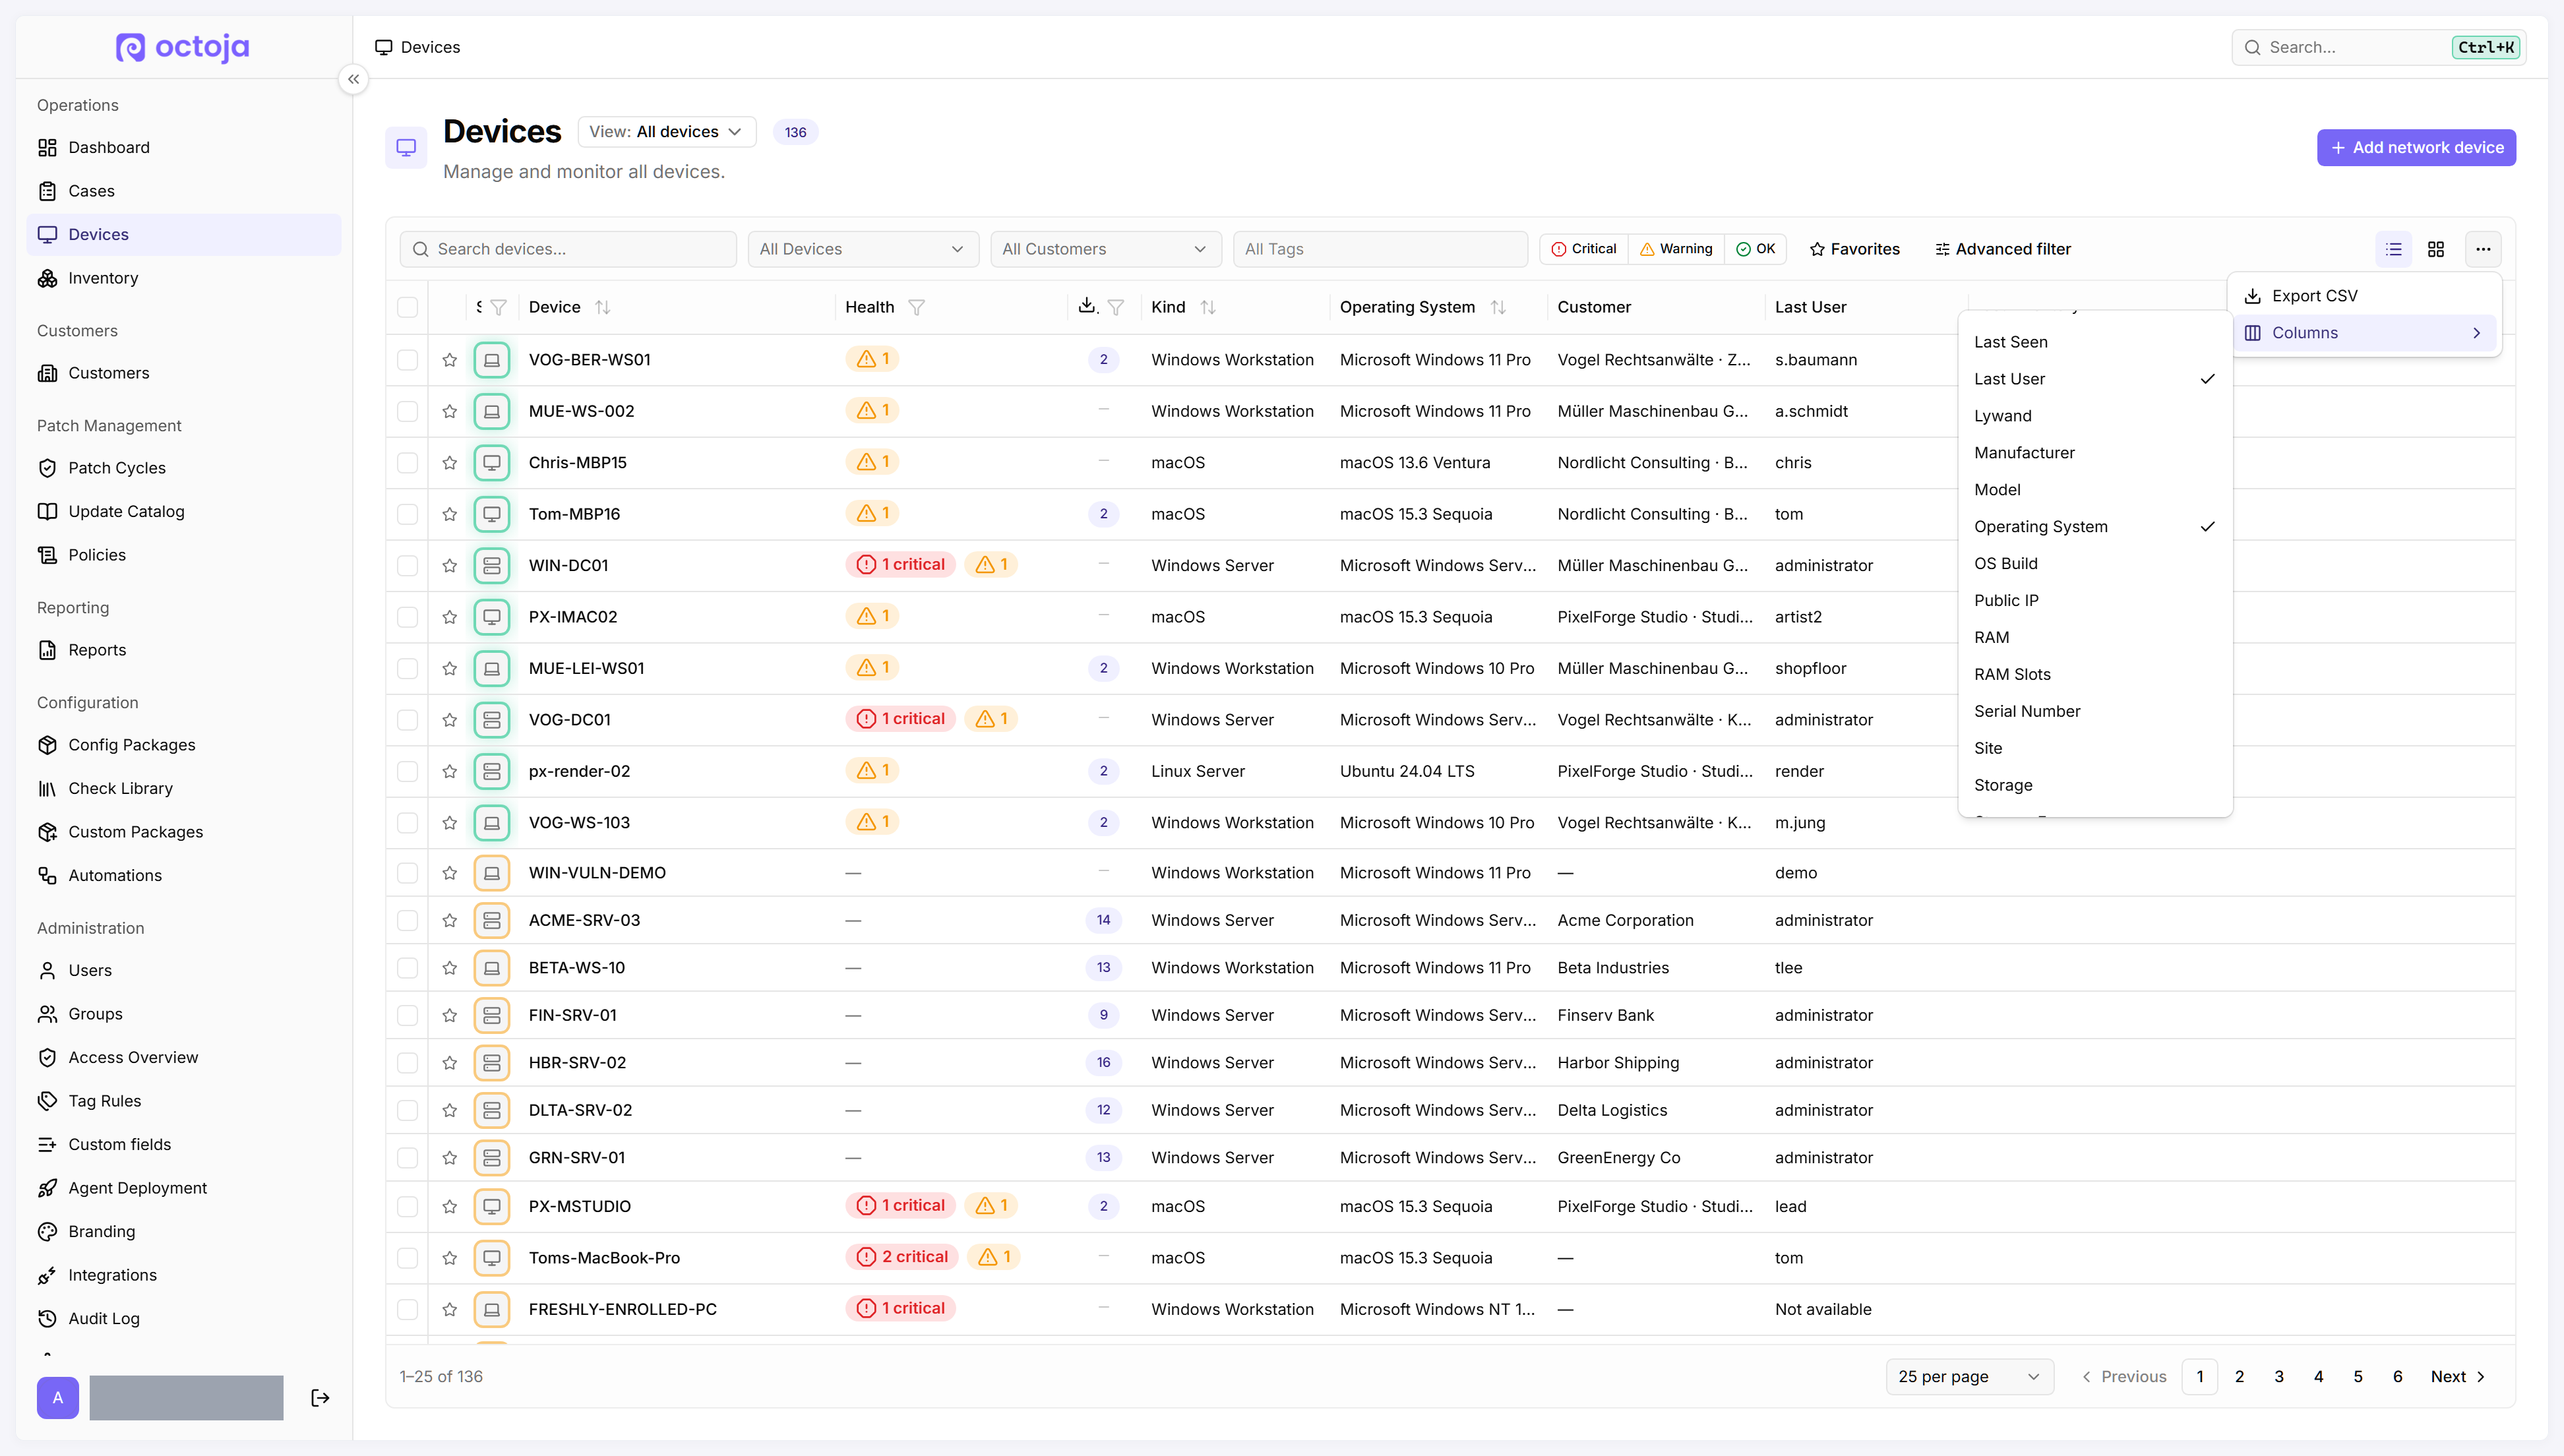
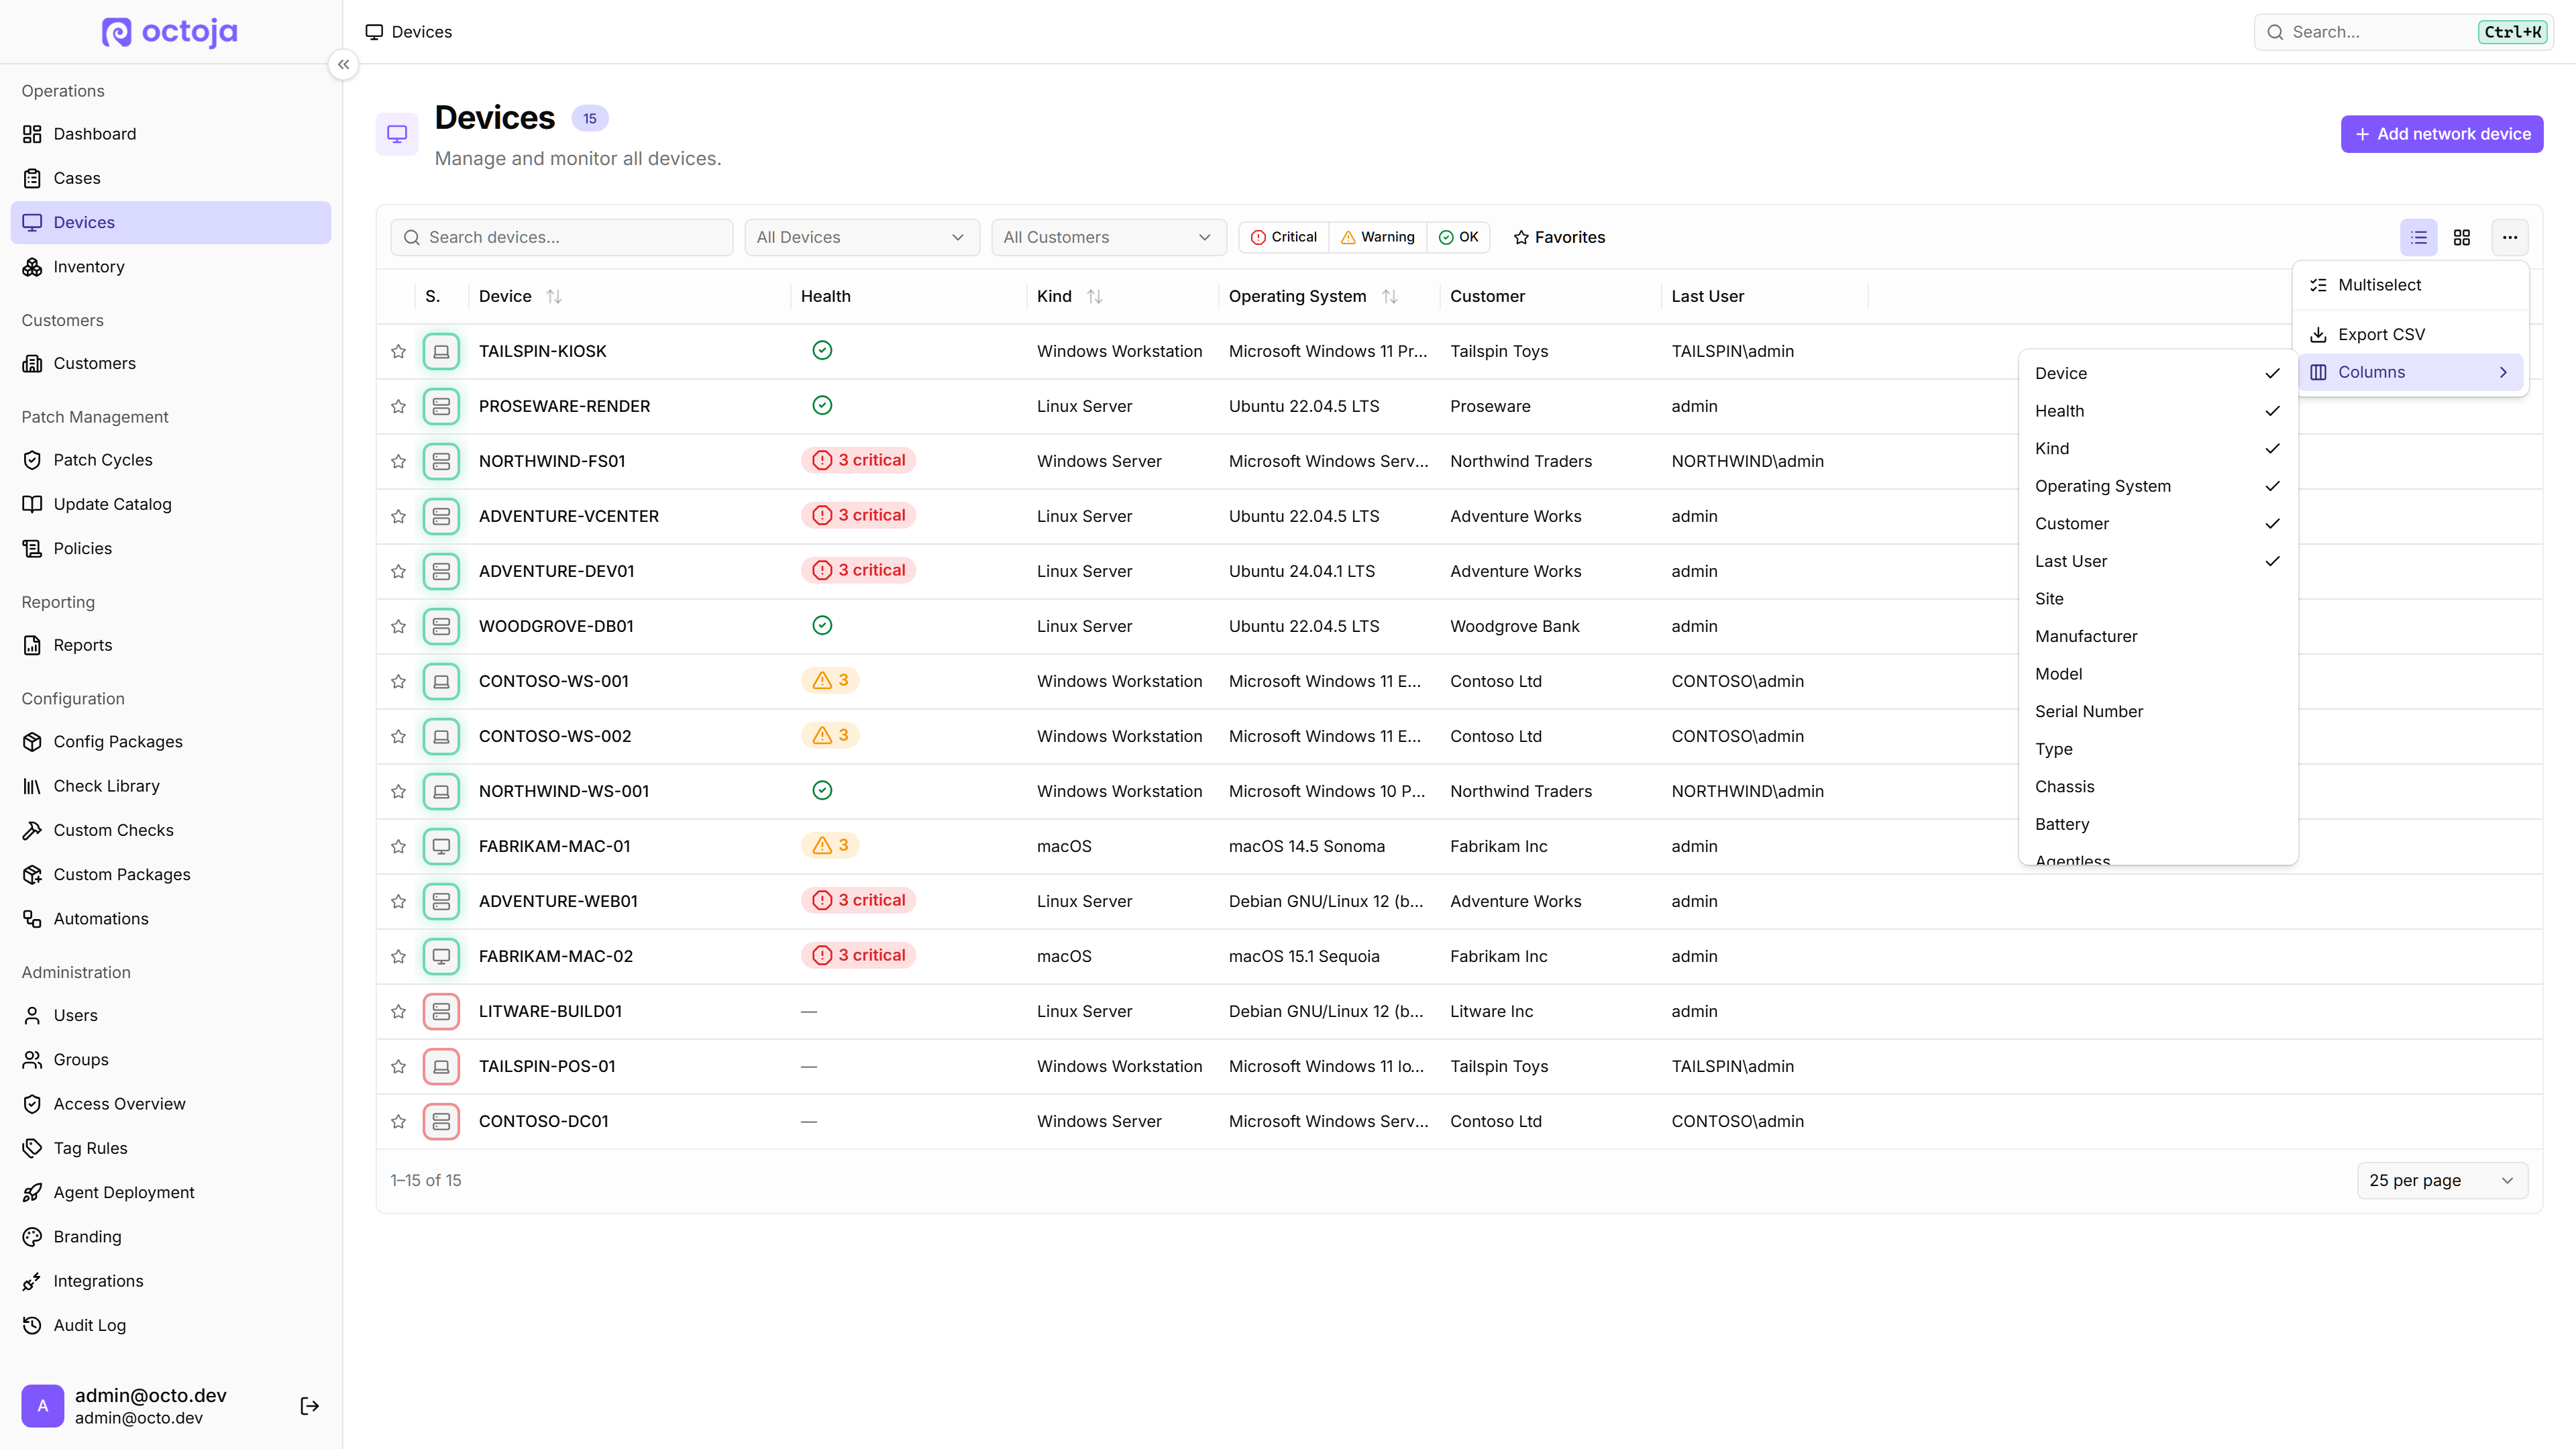
  • Choose which columns to show in the device list, and page size — The device list now offers roughly 30 additional optional columns — manufacturer, model, serial, device type, CPU, RAM, storage, domain, OS build, uptime, IP addresses, agent version, tags, dates and more — that you can show or hide from the column menu. A new page-size selector lets you view 25, 50, 100, 250 or 500 devices per page.
    Choose which columns to show in the device list, and page size
  • New device-targeting fields in the rule builder — You can now target devices in rules by chassis type, whether they have a battery (laptops vs desktops), directory membership (Workgroup, Domain, Azure AD, Hybrid), serial number, agent version and OS architecture. These fields work everywhere rules apply, including config packages, tag rules, patch policies, automations and device group access.
  • Device aliases shown everywhere — Device aliases now appear everywhere a device is named — check alert emails, push and Teams notifications, reports, Cases, time entries, dashboards and device pickers — not just the main device and inventory lists. Lists sort by the displayed name where possible, and automations can reference the alias with a new deviceAlias token while the device-name token still resolves to the real hostname.
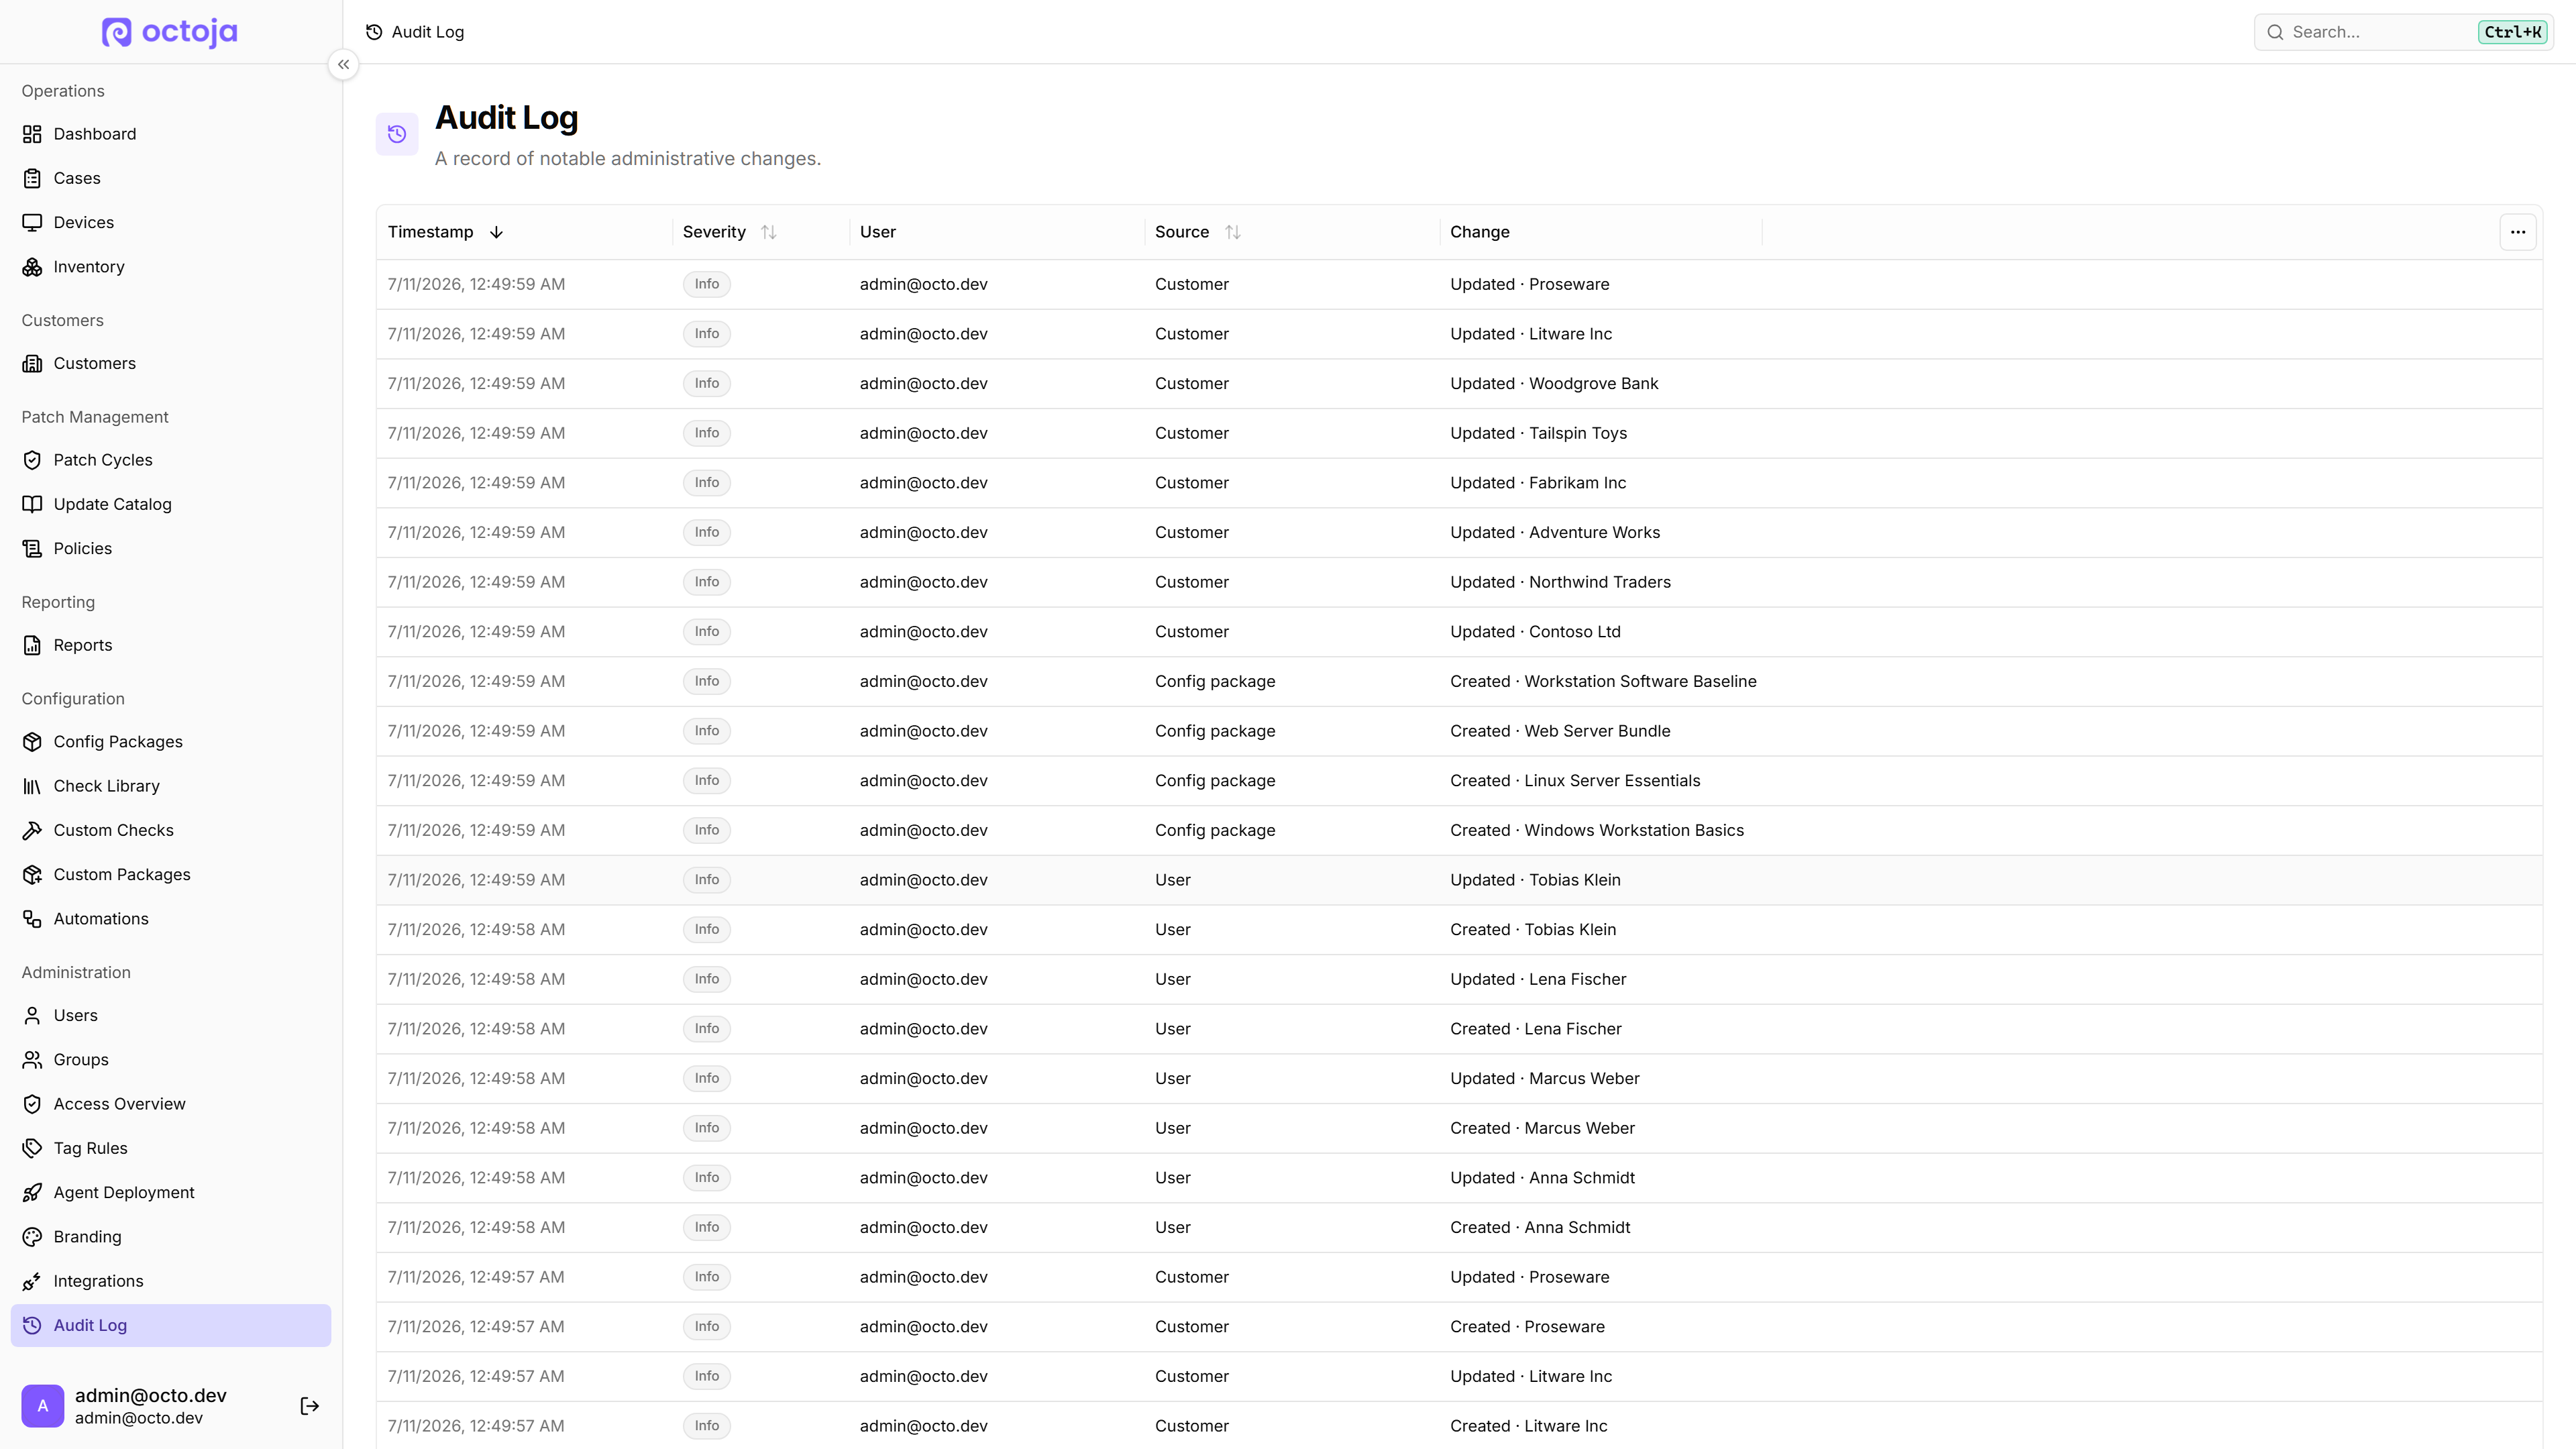
  • Audit log now covers admin changes across the platform — The admin audit log records much more than before. Changes to branding, config and custom packages, custom checks, automations, users, customers and patch policies are now logged, each entry showing which item was changed.
    Audit log now covers admin changes across the platform
  • More control and detail in webhooks — In a webhook's settings you can again pick which events it delivers from a simple checklist, and you can leave inventory updates unselected to create a webhook that carries only monitoring-check alerts. Check-alert messages (failed, warning and recovered) now also include the device name and the customer's name, ID and external reference, so you no longer have to cross-reference a separate inventory message to see which customer an alert belongs to.
  • Securepoint and ESET antivirus checks now run on the device — The Securepoint Antivirus Pro and ESET checks now run directly on each Windows device through the product's local interface instead of pulling status from a vendor cloud portal. Monitoring is more reliable and no longer needs the Securepoint or ESET PROTECT integration connected in admin settings — both integration cards have been removed and your existing checks keep working automatically.
  • RAID check names the failed disk — The RAID check now lists the individual disks in an array and names the exact disk that has failed or degraded, across ZFS pools, Linux software RAID and Windows Storage Spaces. Degraded arrays are detected reliably on more Linux distributions, and a disk logging errors while the pool still reads healthy is now flagged as a warning.
  • Firewall check adds Securepoint and Check Point — The firewall monitoring check now covers Securepoint UTM and Check Point appliances alongside the existing vendors. It reports firmware and update state, license expiry, VPN tunnels, cluster and failover status, and CPU and memory usage, plus disk usage on Check Point.
  • Exclude specific event IDs in the Event Log check — The Event Log check can now exclude individual event IDs, optionally only for a specific source, so you can silence known-noisy events without switching off the whole check. It also reports when it cannot read the event log instead of failing silently.
  • Full check output always visible — Large check outputs are no longer hidden behind a “truncated” banner. The full latest result is now always shown at full size, while only the stored history is trimmed. Updating the agent is required for this to take effect.
  • Clearer Last Seen vs Last Inventory columns — The device list's “Last Reported” column is now labelled “Last Inventory”, and both it and “Last Seen” have tooltips explaining the difference: Last Seen is the most recent contact of any kind and drives online/offline status, while Last Inventory is the last full hardware and software inventory upload, which can lag behind.
  • Cleaner device inventory history for changed services — When a Windows service changes its configuration (for example its startup type), a device's inventory history now shows a single “changed” entry instead of a confusing pair of “removed” and “added” lines.
  • Resolving a vulnerability no longer freezes the app — When you resolve a vulnerability finding on a device, the app no longer locks up while the fix runs. The dialog now closes immediately and a notification reports success or failure when the device finishes, instead of dimming the whole screen for up to several minutes.
  • Edit report-schedule recipients inline — Adding and editing recipients on a scheduled report now happens directly in cards on the schedule page instead of a separate popup. Each card lets you pick a customer, site and email addresses, and a single Save persists the whole schedule. A note clarifies that recipients are set per customer.
  • Warning before leaving a page with unsaved changes — octoja now prompts you before you navigate away or close the tab with unsaved edits open. It covers the customer, user, group, patch policy, report template, report schedule, custom check, config package, tag rule and automation editing pages, so you no longer lose work by clicking away by accident.
  • Open any list row in a new tab — You can now middle-click or Ctrl/Cmd-click a row in any list to open it in a new browser tab, exactly like a normal link. Left-click still opens it in place.
  • See the full customer or site name in the dashboard tree — Long customer and site names in the dashboard tree were cut off with no way to read them. Hovering or focusing a row now shows the full name in a tooltip.
  • Confirm before uninstalling software from a device — Uninstalling a package from a device's software list now asks you to confirm first, guarding against an accidental removal.
  • Software Kiosk toggle when creating deployments — You can now set “Show in Software Kiosk” while creating a software deployment, not only when editing one, and deployment rows now show a badge indicating which packages are visible in the kiosk.
  • Automations can update all outdated software at once — Software-installation automations gained an “update all outdated” mode that upgrades every outdated package a device reports, instead of naming a specific package. In this mode the form hides the version and package-name fields.
  • Clearer DocBee connection-test errors — When a DocBee integration connection test fails during setup, octoja now shows the failure in a clear alert with a hint to double-check the base URL — it usually needs to end with /restApi and the casing must match exactly.
  • Faster file downloads in deployments and scripts — Software deployments, custom checks and installer scripts that download files complete noticeably faster on Windows.

Fixed

  • Devices no longer disappear after their customer is deleted — A device that reconnected after its assigned customer had been deleted could vanish from every view and stay hidden permanently. These devices now stay visible and can be reassigned, and any already-affected devices are restored automatically.
  • Remote desktop recovers cleanly when a user logs off — If the signed-in user logs off, the device restarts, or the remote session disconnects during an active remote-desktop session, the viewer no longer freezes on the last frame. It now shows a clear “the remote session ended” message and returns you to the session chooser so you can reconnect to the login screen or another session.
  • On-device prompts and indicators follow screen changes — After a screen-resolution change, the octoja agent's notifications, consent prompts and the remote-desktop session indicator now appear in the correct place on screen instead of floating mid-screen. Open overlays also reposition immediately when the resolution changes during a session.
  • macOS agent interface no longer stuck in a restart loop after an update — On macOS, the octoja agent's on-device interface could get caught in a restart loop after an update. The agent now repairs itself before launching the interface, so it opens normally.
  • Pending updates no longer flicker away on a scan hiccup — The Updates tab on a device no longer briefly empties or shows every pending update as removed when an update scan hits a temporary error. The previously known list is kept until a scan genuinely completes.
  • Dashboard check-type and severity filters now match per check — When you filter the dashboard by a specific check type together with a severity, the severity now applies to that check's own result. Previously, combining an “online” check filter with “Critical” also returned devices whose online check was fine but that had some unrelated check in a critical state.
  • Device Checks badge ignores disabled checks — The warning and error count badges on a device's Checks tab now ignore disabled checks, so they reflect only the checks that are actually running.
  • SMART check recovers immediately after a disk is removed — Fixed the SMART disk-health check staying red for up to three days after you removed or decommissioned a disk, which had hidden the health of the remaining disks. Disk-removal detection now lives in its own check, so SMART recovers as soon as the surviving disks are healthy.
  • Veeam backup check no longer fails on healthy machines — The Veeam Backup Agent check no longer reports a failure on machines whose backups are actually fine. Previously it could stop early and show an error instead of the real backup status; it now finishes and reports the correct result even when a single event-log entry can't be read.
  • HP iLO check stops false-alarming on servers with empty bays — The HP iLO hardware check no longer raises a permanent warning on HP ProLiant servers that have empty fan or power-supply bays. Empty bays are now hidden and ignored, while genuine fan, power, memory, drive and temperature faults still alert.
  • MailStore SPE user-count check now works — The MailStore Service Provider Edition (SPE) check used to fail every time instead of returning results. It now runs correctly and reports how many users are in each MailStore instance.
  • Accurate example payloads in webhook help — The webhook help dialog now shows correct example payloads for every event that carries data — inventory updates and all check alerts — including the new device and customer fields. Previously the check-alert examples were the wrong shape and only the inventory example ever appeared.
  • Links to ticketing systems and notifications respect your custom domain — Device, object and remote-support links that octoja passes to connected ticketing systems and notifications now use your configured custom domain instead of falling back to an octoja.cloud address. Previously customers on a custom domain received links pointing at the wrong domain.
  • Clearer empty alert channel targets — When editing an alert's notification channels, a target you haven't picked yet now shows a readable “select a channel” prompt instead of a meaningless string of zeros.
  • Automation and schedule configuration polish — Cleaned up the automation and schedule configuration screens. The schedule-override popup no longer runs off the edge in narrow panels, human-readable schedule descriptions now appear in your language on every page, the options for linking an existing automation are fully translated in German, French and Dutch, and a step you haven't renamed no longer shows its type label twice.

July 6th, 2026

New

Improved

Fixed

Highlights

This release sharpens reporting and remote support. Reports gain a device-availability widget and a dedicated set of Sophos widgets with a ready-made template, so you can show uptime and protection at a glance. Remote desktop is steadier all round — the "connected" notice now stays with the person being helped, sessions no longer fail to start on some machines or lock mid-session, and they fill the screen properly on high-DPI displays. Underneath sit a batch of monitoring-check accuracy fixes for Sophos and Cove Backup, calmer device inventory, and smaller polish across rules, patches, webhooks, and integrations.

New

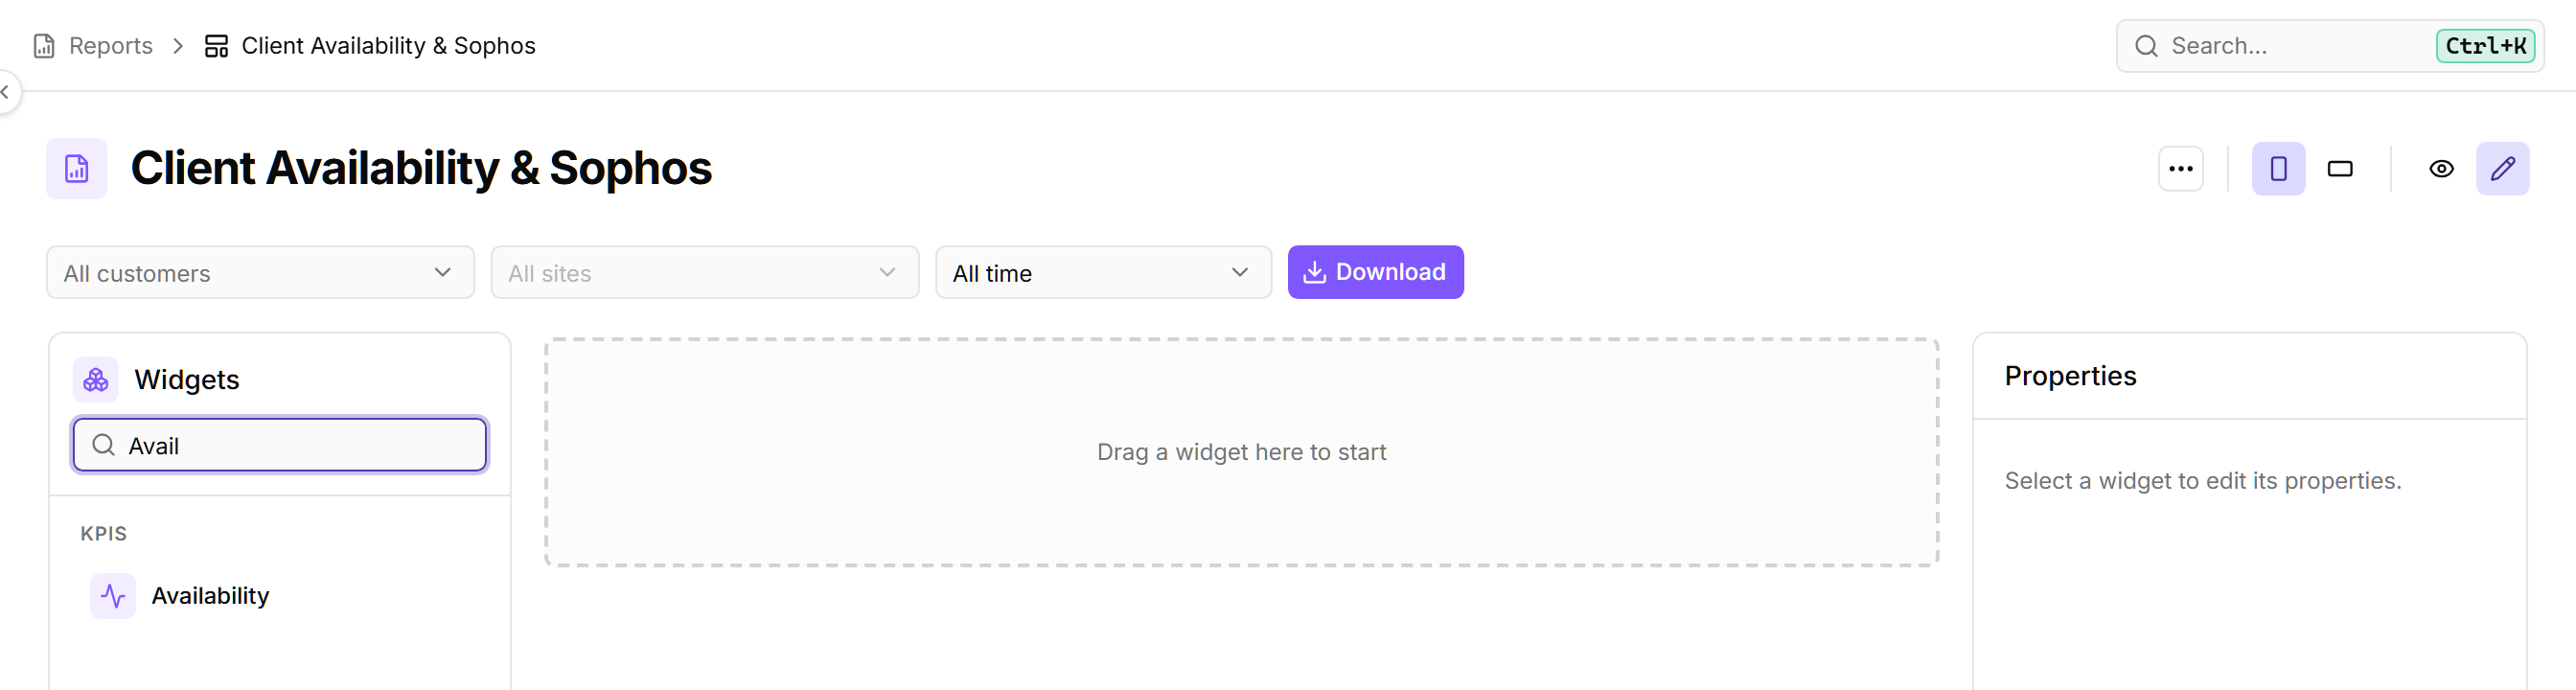
  • New "Availability" widget for reports — Build reports that show, at a glance, the percentage of time your devices were online over the reporting period. Add the new Availability widget and optionally limit it to specific devices. It counts only devices that have the “Device online” check assigned. Read more

    New "Availability" widget for reports
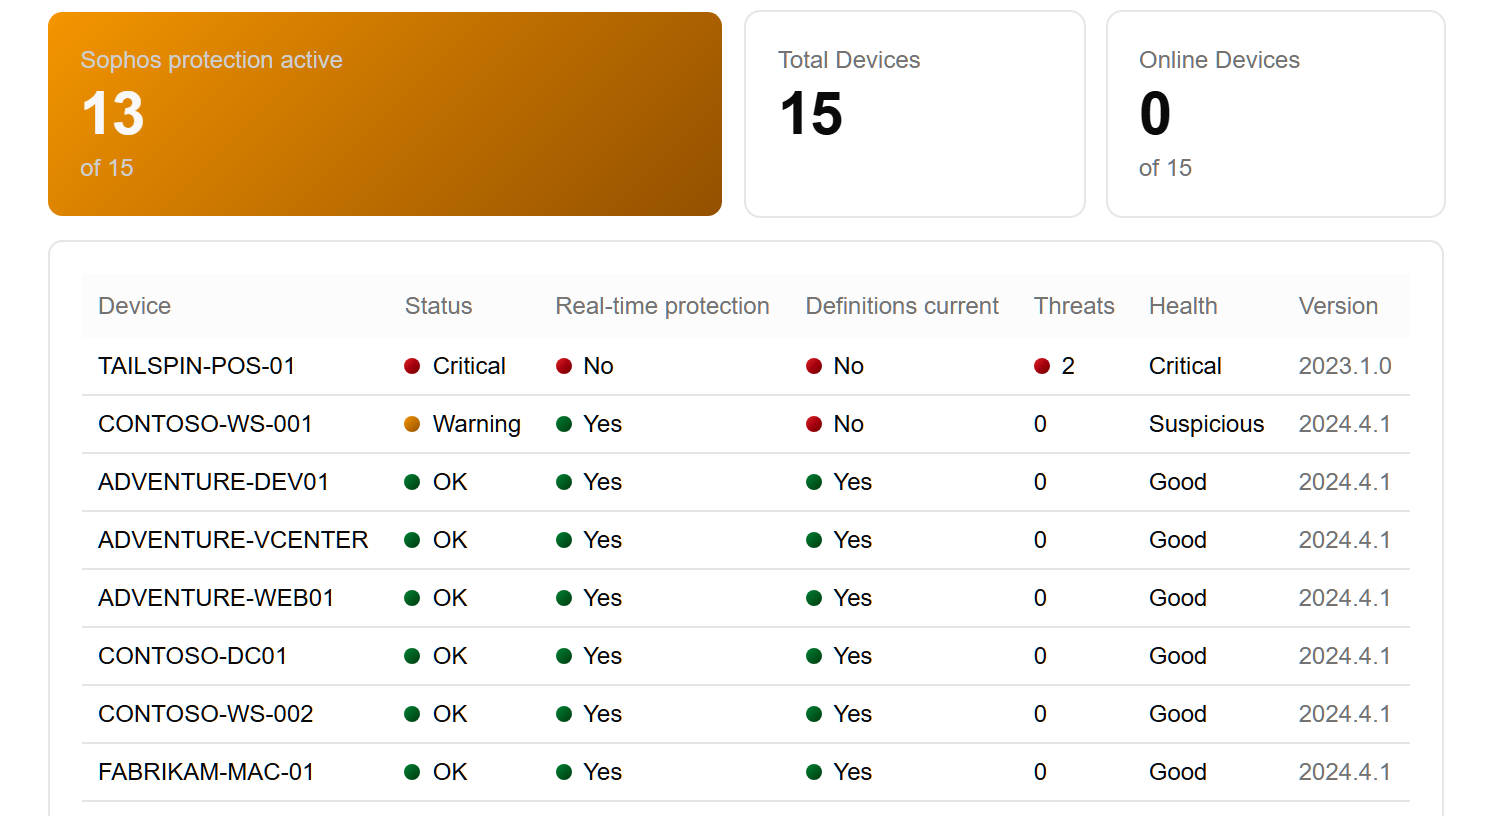
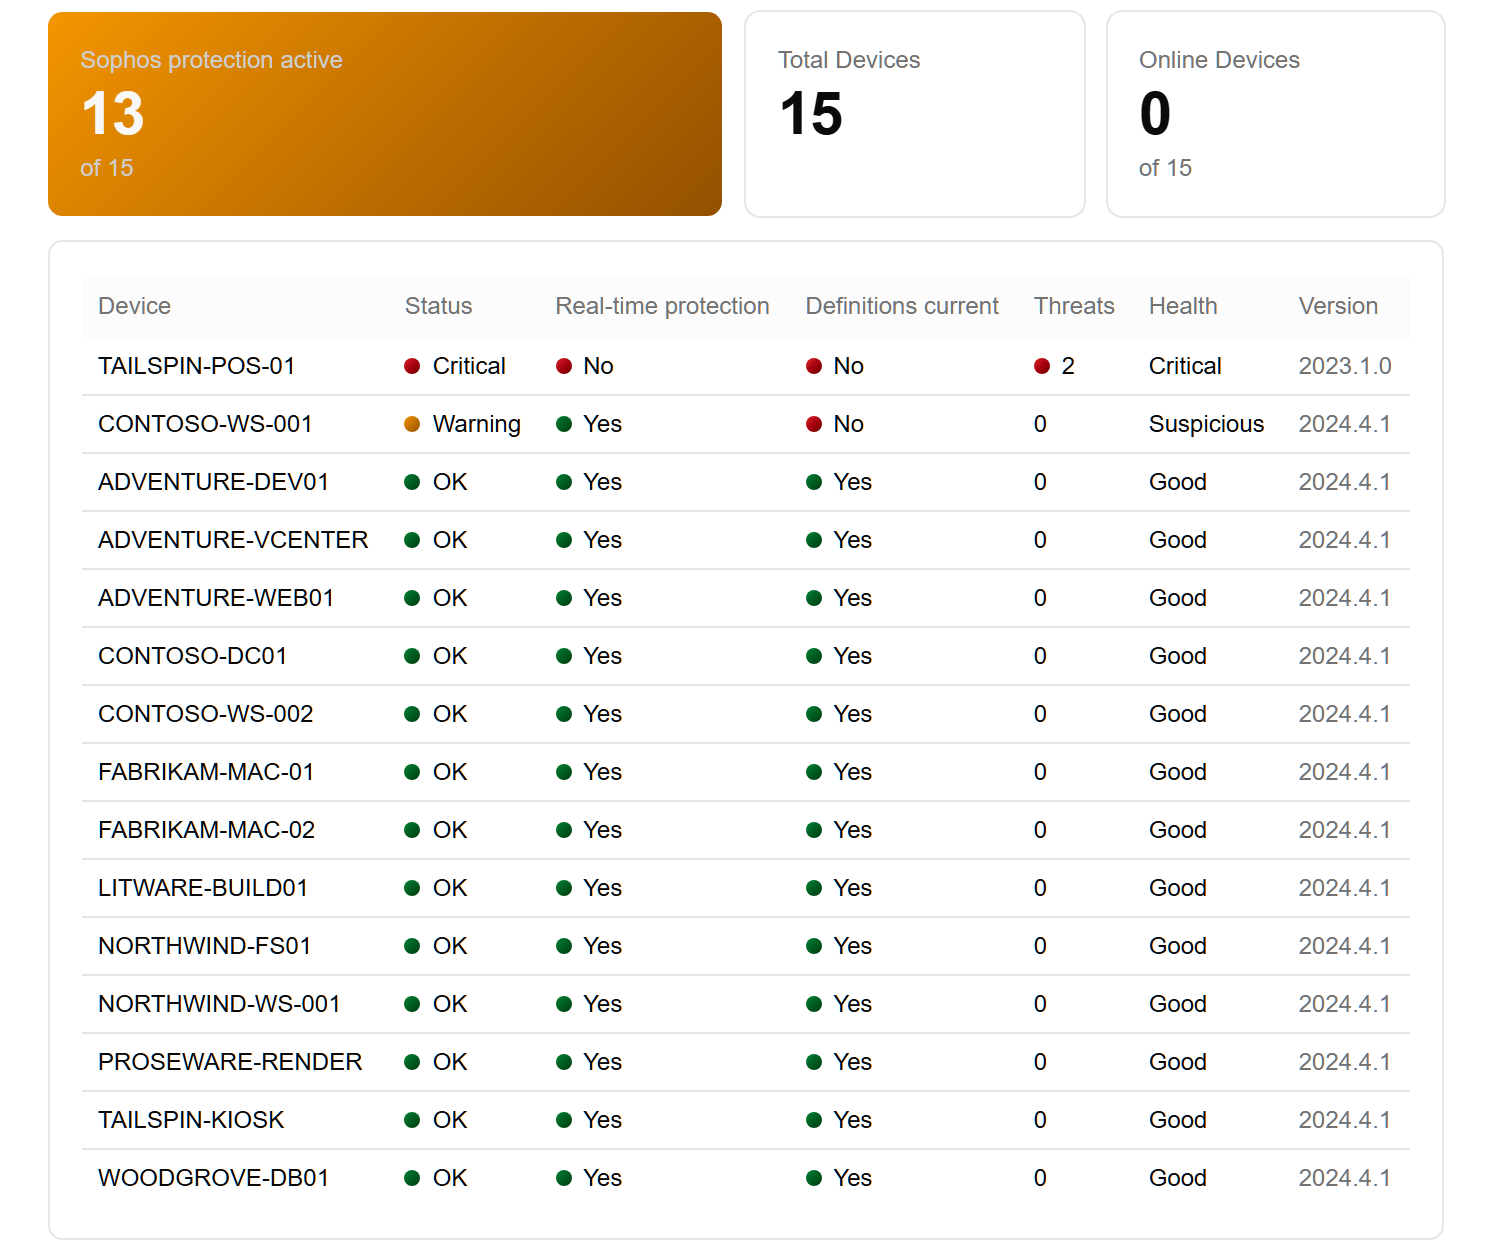
  • Dedicated Sophos widgets and a ready-made Sophos report — Reports can now show Sophos antivirus detail directly: add the “Sophos protection active” KPI and the “Sophos status (table)” block, which lists each device's real-time protection, definition currency, detected threats, health and product version. A built-in “Sophos Report” template combines both, so you can add a finished Sophos report without building it from scratch. Read more

Improved

  • Webhook inventory updates only fire when device details actually change — If you send device inventory to another system through a Webhook, octoja now only delivers an update when a device's core details — its hardware, network adapters, or identifying information — actually change. Routine background changes like a new installed program or a pending update no longer trigger a fresh delivery every hour, so the receiving system gets far fewer redundant inventory updates. Read more

  • Rule builder flags conditions that are missing a value — When you build a rule and pick a field and operator but leave the value blank, that condition now stands out in amber with a warning icon and a hint, so you can spot and finish incomplete conditions before saving. It works everywhere you build rules, including config packages, patch policies, tag rules, and access groups. Read more

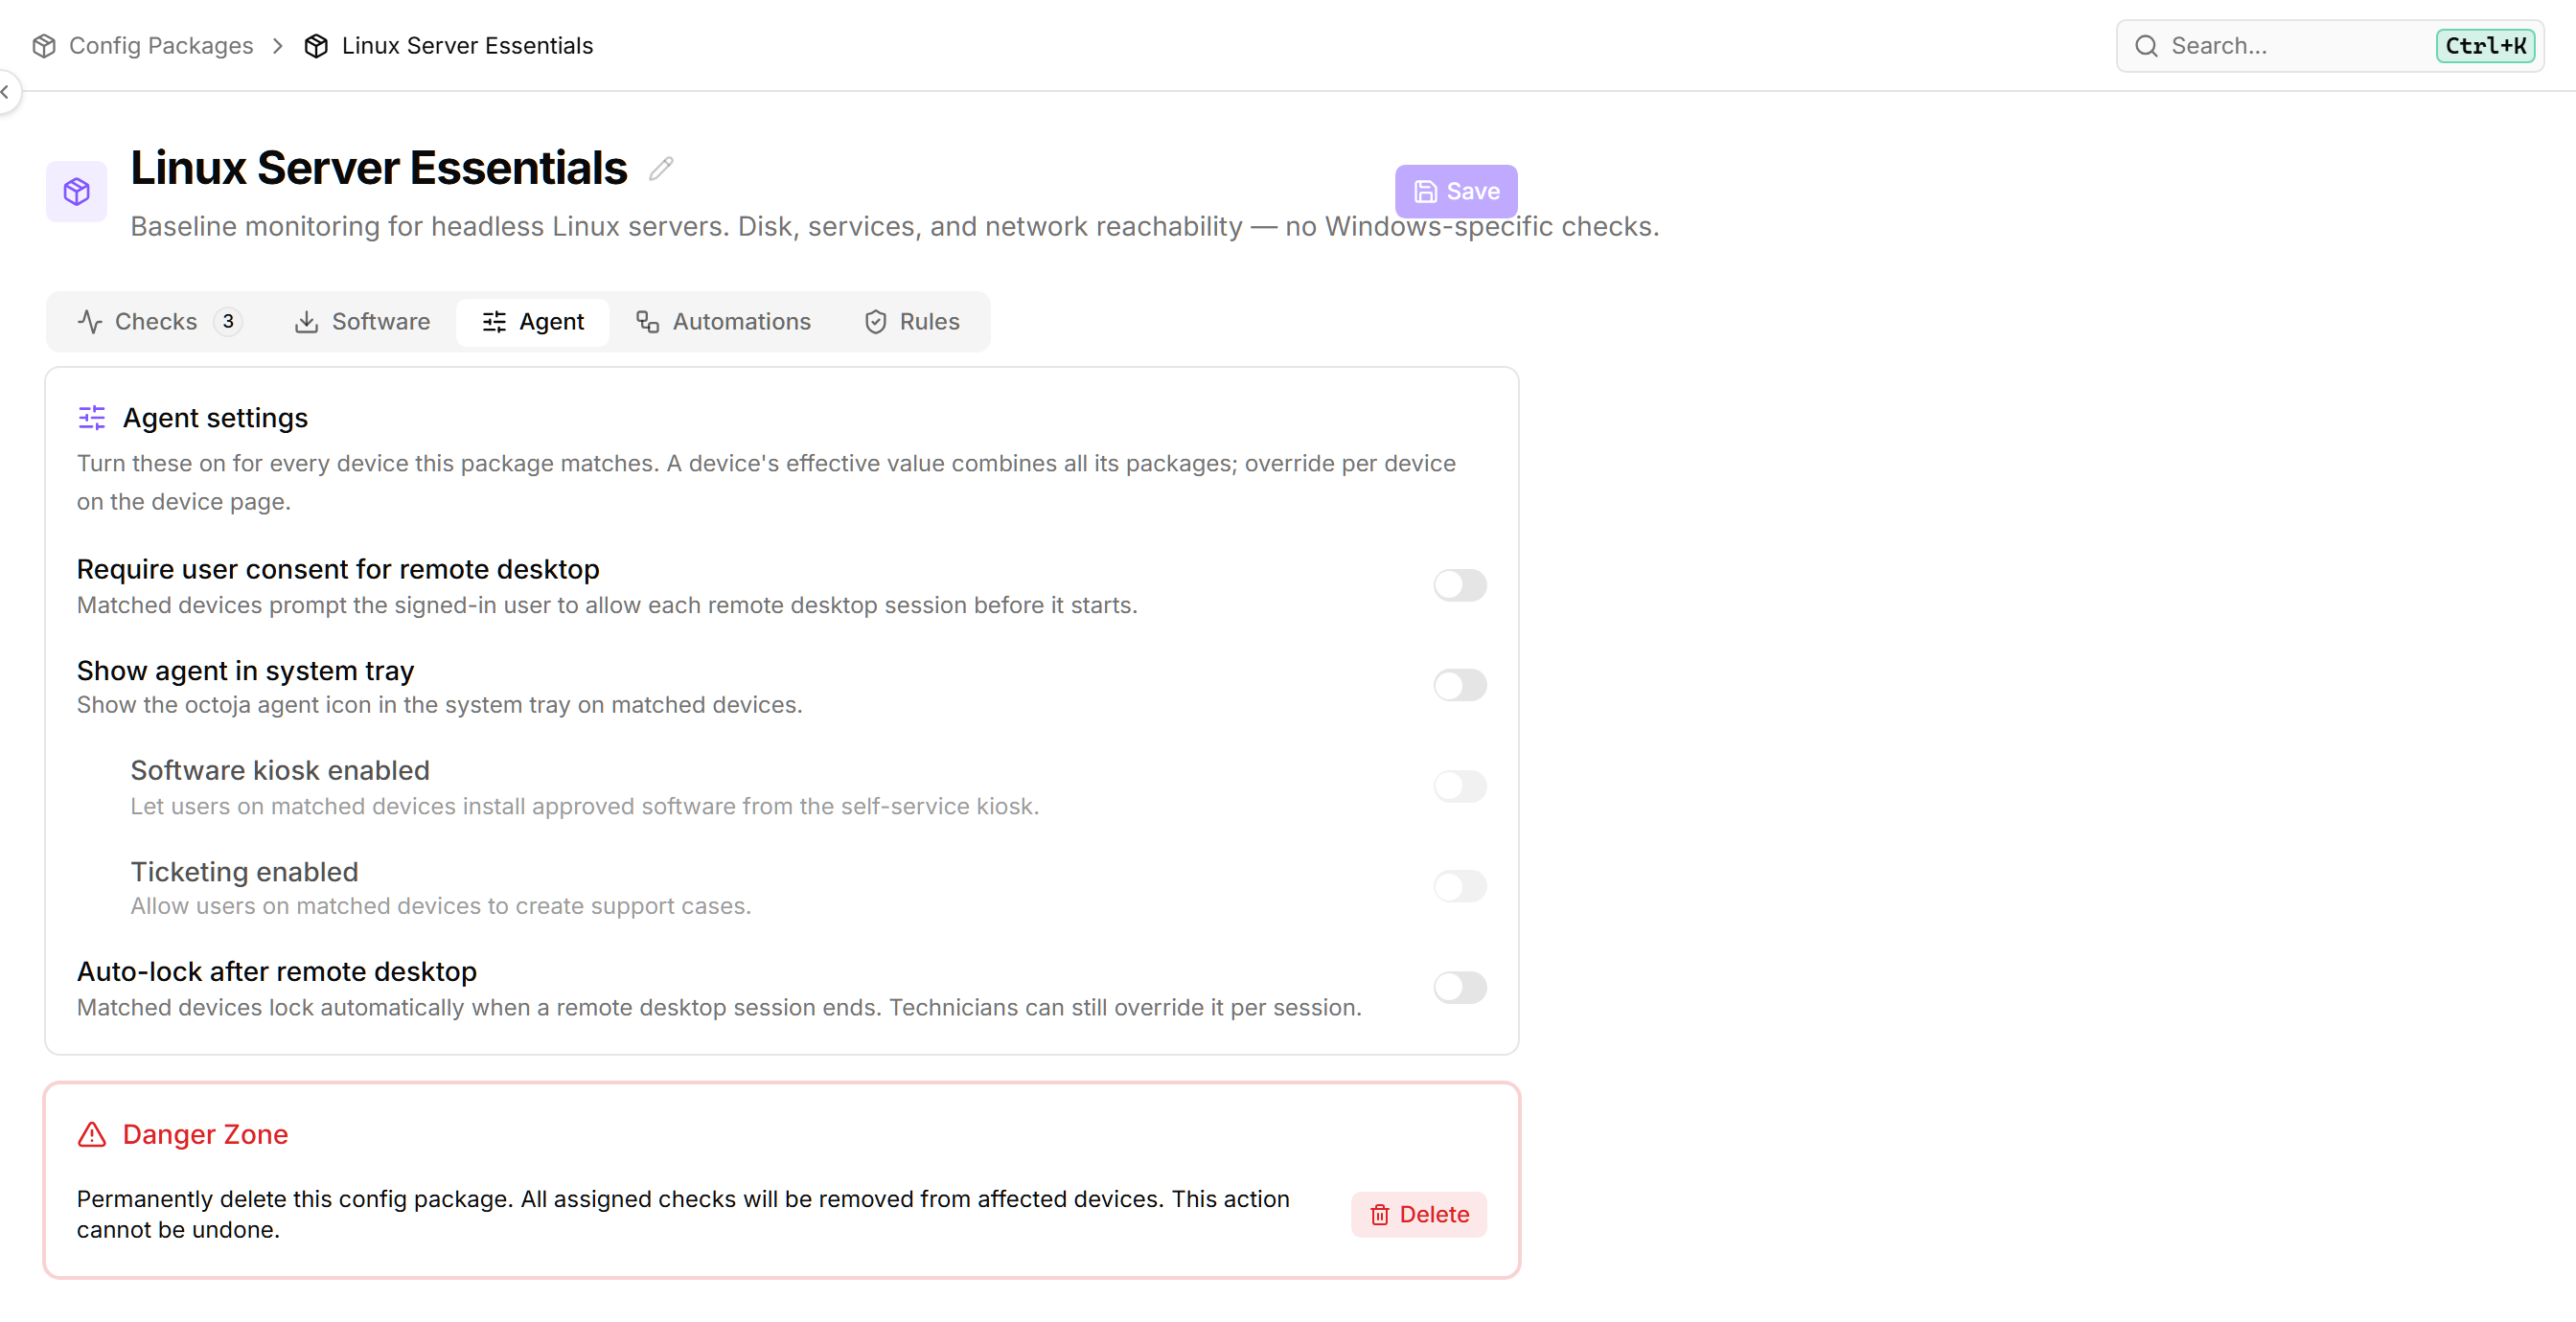
  • Kiosk and ticketing settings now follow the tray icon — In device and configuration-package agent settings, “Software kiosk enabled” and “Ticketing enabled” now sit under “Show agent in system tray” and grey out when the tray icon is turned off, since both features only reach people through that icon. Read more

    Kiosk and ticketing settings now follow the tray icon
  • Tidier help menu in the header — The row of look-alike icons in the top bar has been cleaned up: Feature Request stays as its own button, and Tickets, Feedback portal, and Help & docs now sit together under a single “…” menu, each shown with a clear label so the options are easy to tell apart. The old Community link has been removed.

Fixed

  • Remote desktop notice now reaches only the person being helped — On shared machines where several people are signed in at once, the on-screen notice that a technician has connected — including the technician's name — used to appear for everyone, not just the person actually being helped. It now shows only to that person, so a technician's name is no longer visible to other signed-in users. Read more

  • Remote desktop no longer fails to connect on some machines — Remote desktop sessions could fail to connect on certain devices — often at the Windows login screen — with a “Connection failed” error. Sessions now automatically switch to a working video method when the first one can't start, so the connection goes through.

  • Remote machine no longer locks mid-session — Fixed an issue where the remote computer could unexpectedly lock in the middle of a remote desktop session, especially when switching between the machine's monitors. The “Lock remote on disconnect” setting now stays in sync for every technician viewing the same session, so it only locks when the session actually ends.

  • Remote Desktop shows the full screen on high-DPI displays — On devices with scaled or high-DPI monitors, a Remote Desktop session could show only the top-left corner of the screen instead of the whole display. The full desktop now appears correctly.

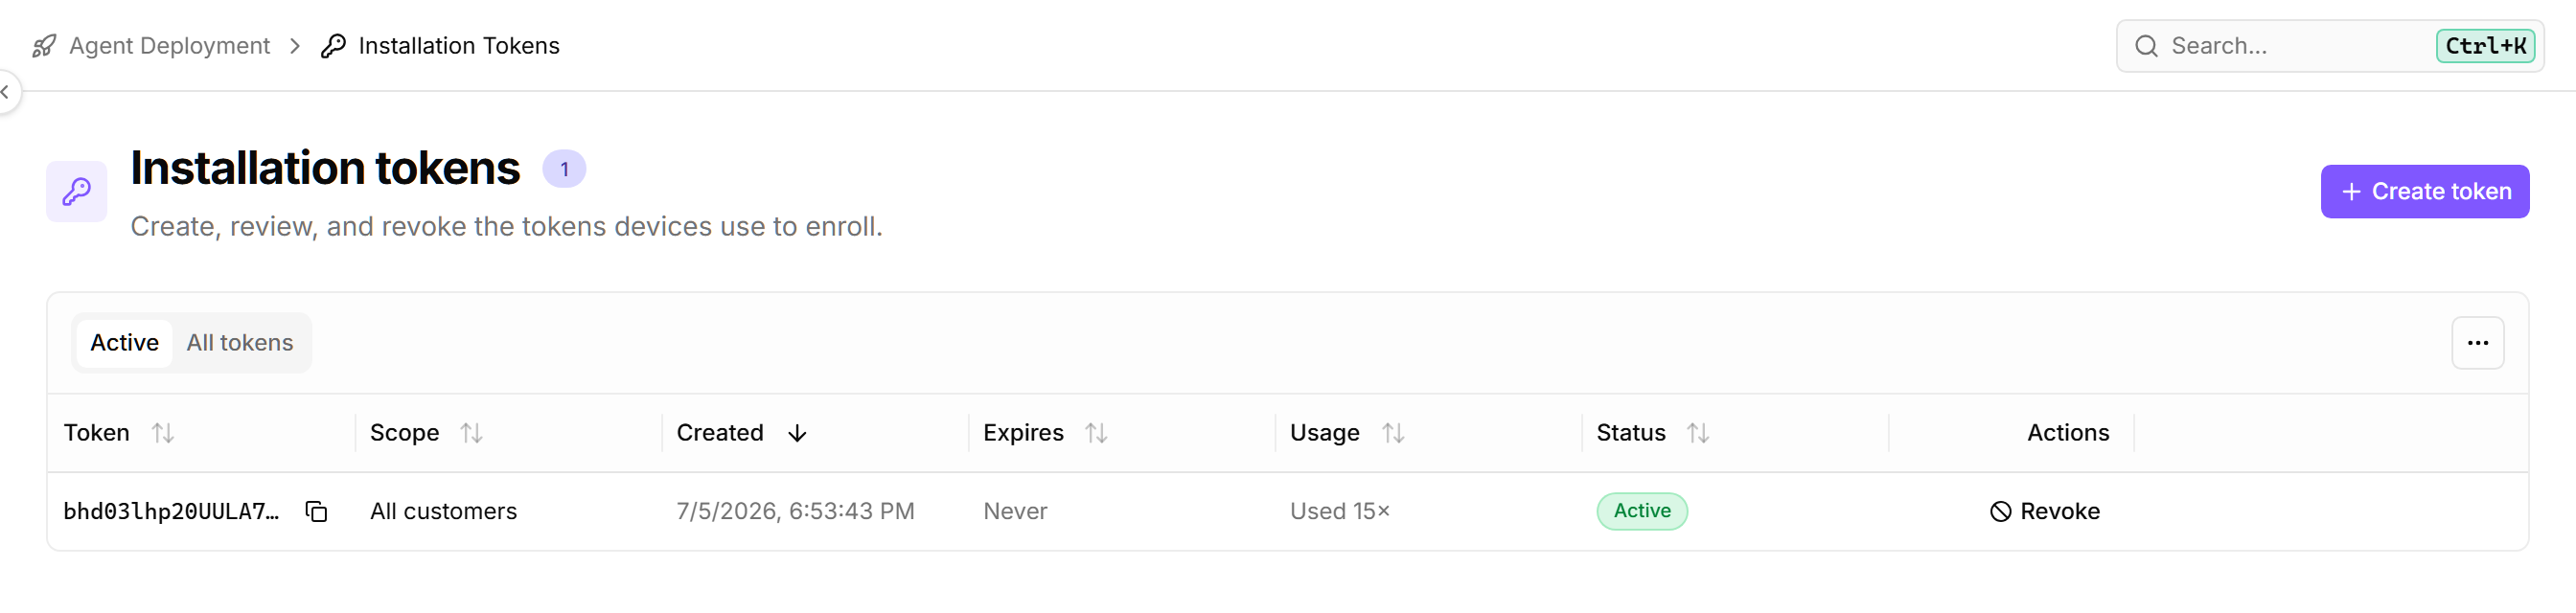
  • Revoke button now appears on the Installation Tokens page — The button for revoking an installation token was missing from the Installation Tokens page, so there was no way to turn off a token from the list. It now shows up in a labeled Actions column next to each token. Read more

    Revoke button now appears on the Installation Tokens page
  • Imported customers now appear for team members with group-limited access — Customers added through Import Customers could stay hidden from team members whose view is limited to specific groups, even though the customers imported successfully. Bulk-imported customers now show up for everyone who should be able to see them, just like customers you add one at a time. Read more

  • Integration customer-matching count now respects your access — On an integration's Customer mapping card, the “X of Y customers matched” count now reflects only the customers you can access, instead of showing the total for the whole account. Team members with limited access no longer see a total that includes customers outside their scope.

  • More reliable Sophos protection reporting — The Sophos check now reports an accurate definitions date, no longer flags a false warning on Windows Servers where it couldn't read how current the definitions were, and no longer comes back empty on certain Sophos versions. Read more

  • Cove Backup check no longer flags healthy backups — The Cove Backup monitoring check sometimes showed a warning even when a device's backups had completed successfully. It now reads the backup history correctly, so healthy backups report as healthy. Read more

  • No more phantom "Last boot" changes in device history — A device's inventory history no longer fills up with repeated “Last boot” change entries where the before and after times are the same. The recorded boot time now stays put between restarts, so the history only shows a change when the device actually reboots.

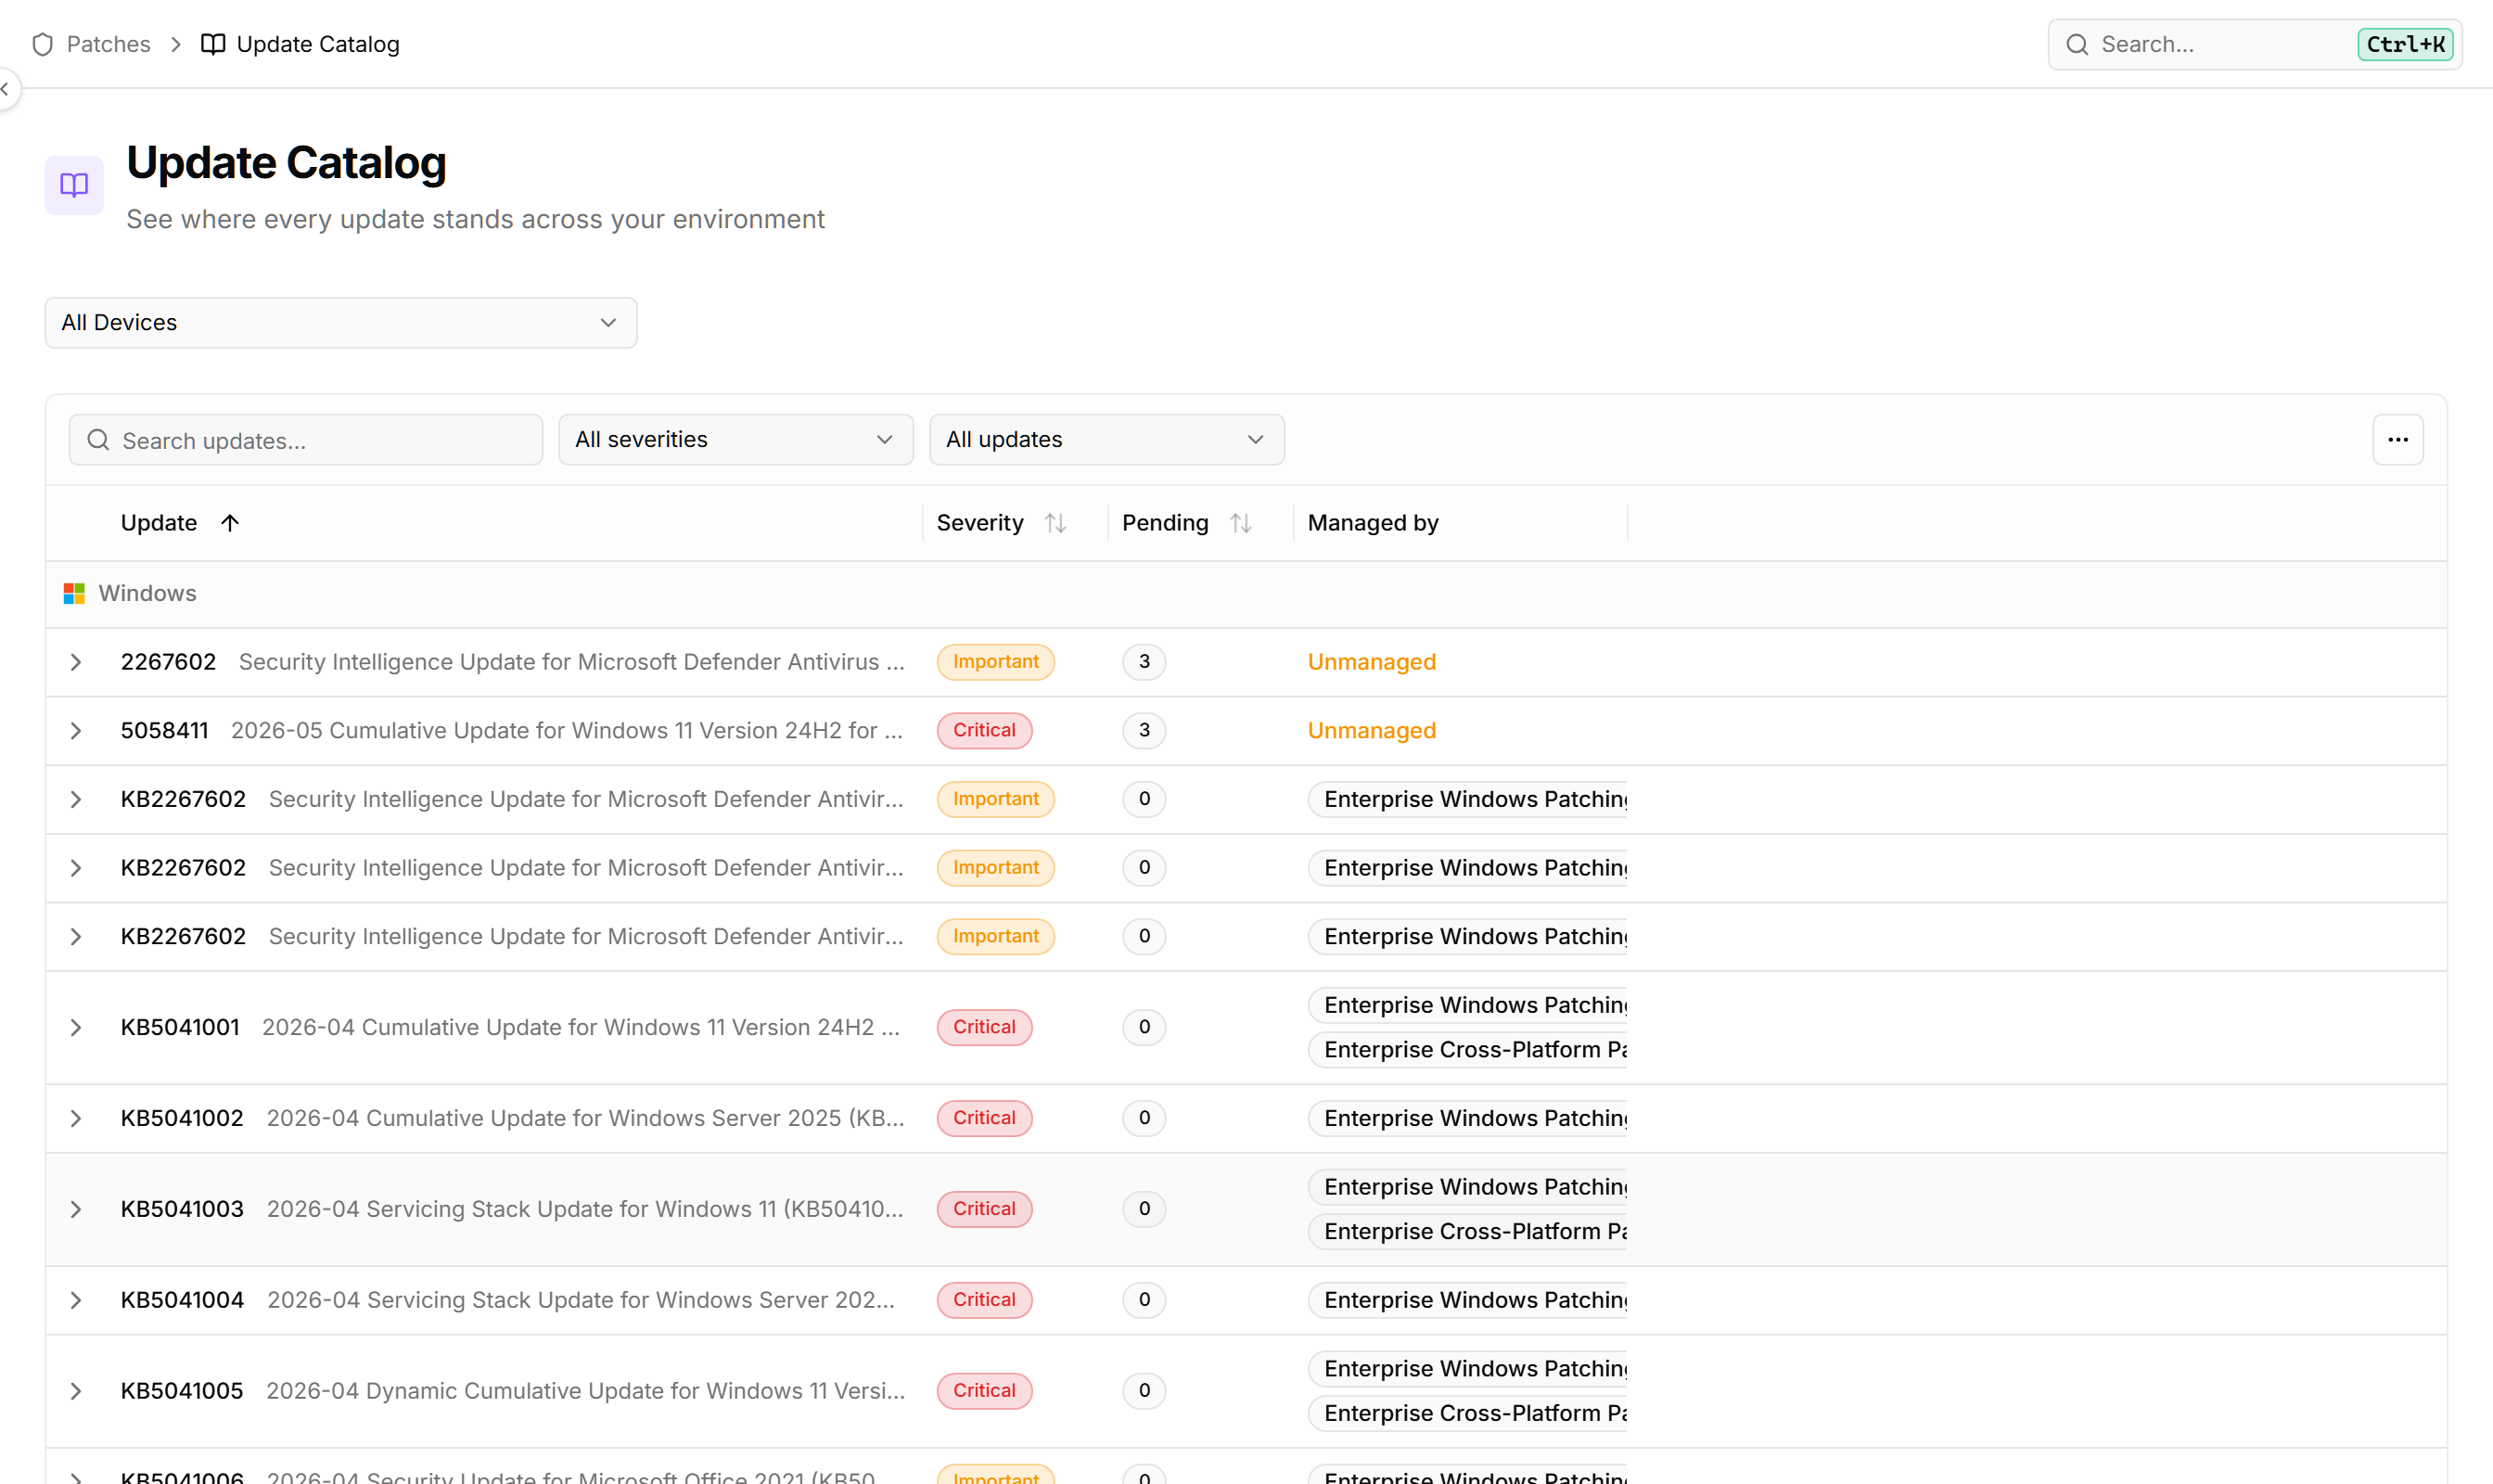
  • Patch screens display correctly with large policies and long update names — The Emergency rollout dialog no longer runs off the screen when a policy has many updates or rings — its contents now scroll and the Cancel and Create buttons stay reachable. In the Update Catalog, the update column is now wide enough that titles are no longer cut off, including in the per-policy view. Read more

    Patch screens display correctly with large policies and long update names
  • Command bar stays ready to type — Opening the command bar with Ctrl+K now reliably lets you start typing right away. Previously the help widget loading in the background could quietly take the keyboard, so your first keystrokes went nowhere until you clicked back into the search box. Read more

  • More reliable agent installs on Linux and Windows — Installing the octoja agent now works on ARM-based Linux devices like Raspberry Pi, which were previously rejected, and on minimal Ubuntu servers that lack the unzip tool and used to fail during install. On Windows, if a firewall, proxy, or web-protection product intercepts the download and returns a fake page instead of the installer, you now get a clear message pointing at the likely cause instead of a confusing error. Read more

July 1st, 2026

New

Improved

Fixed

On 1 July at 2 PM CEST, we present this release and much more in the octoja webinar.

https://us05web.zoom.us/webinar/register/WN_6RqlhYeaRL6DxbiTv_5hrA#/registration

Highlights

This is octoja's biggest release yet. The headline is Automations, a visual workflow builder that lets you wire triggers, conditions, and a growing library of actions into workflows that run across your devices. Alongside it comes a self-service app that lives right on your team's computers, on-device antivirus checks that no longer depend on a vendor cloud, one-click vulnerability fixing, scheduled report delivery, and an audit log for administrative changes. Tables across the whole product now sort, filter, and export the same way, the device page gained live per-adapter network speed and a full inventory history, and there's a long batch of patch-management, remote-desktop, and cross-platform reliability work underneath. The rest is polish and stability throughout.

New

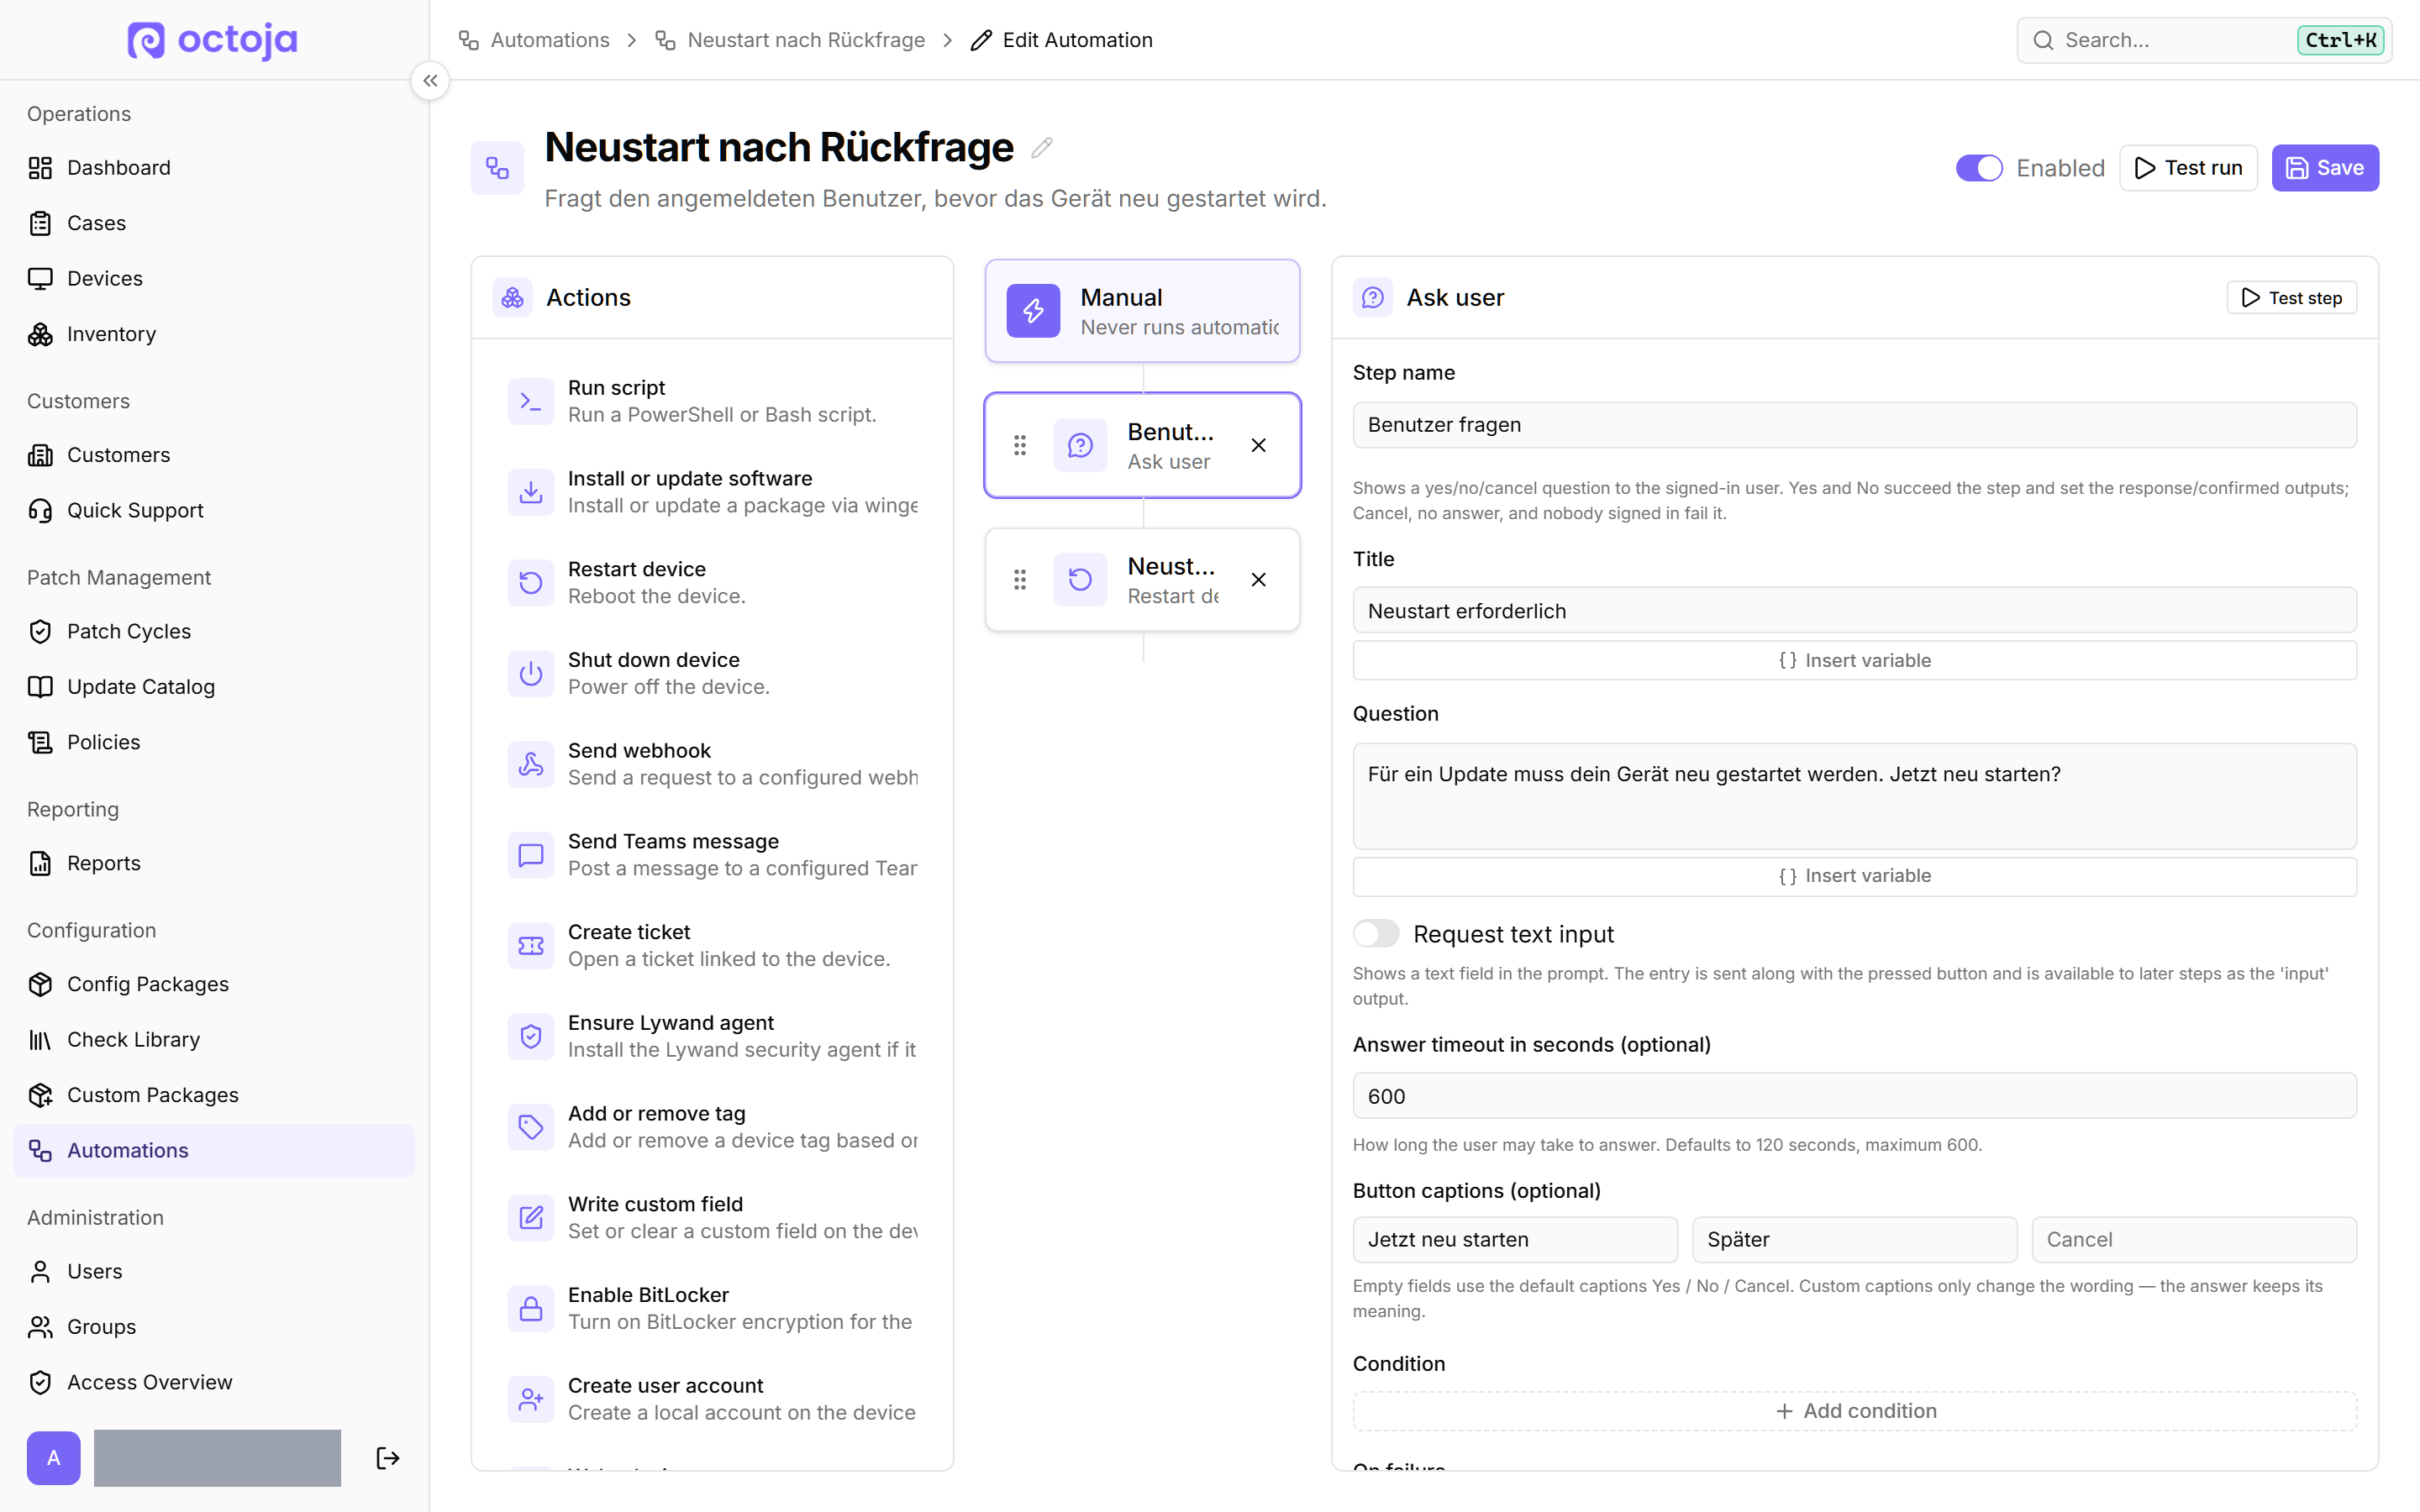
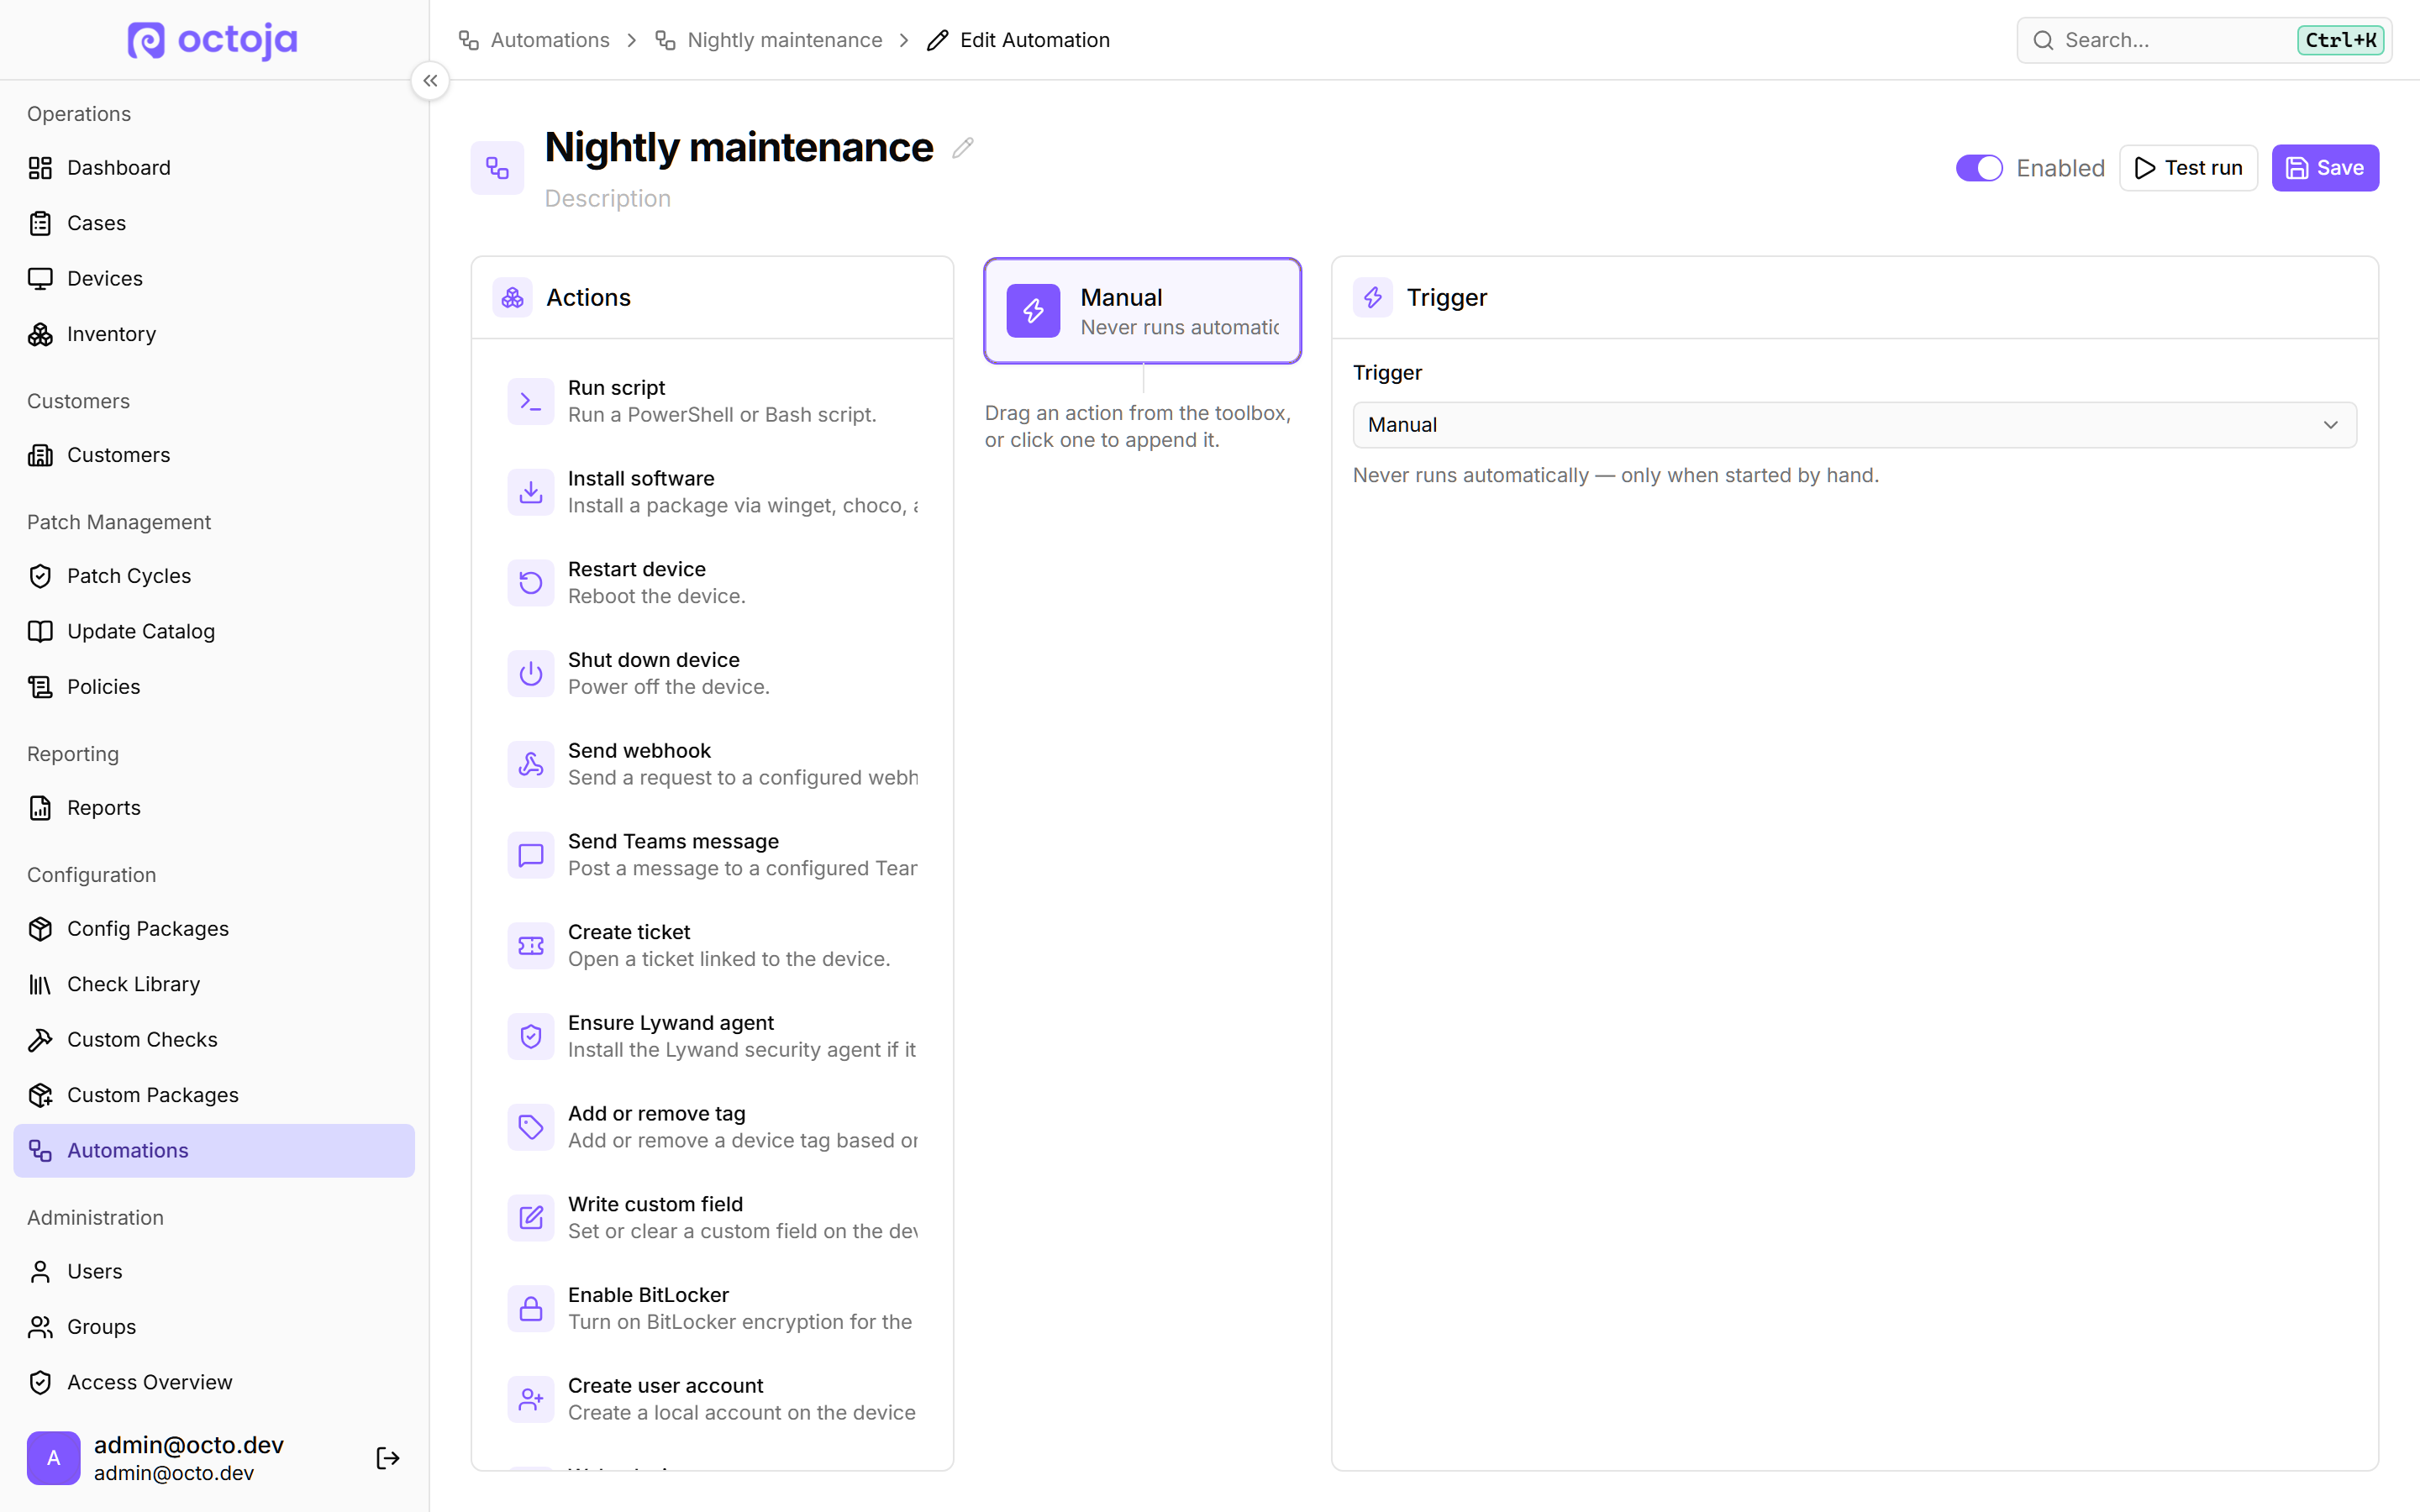
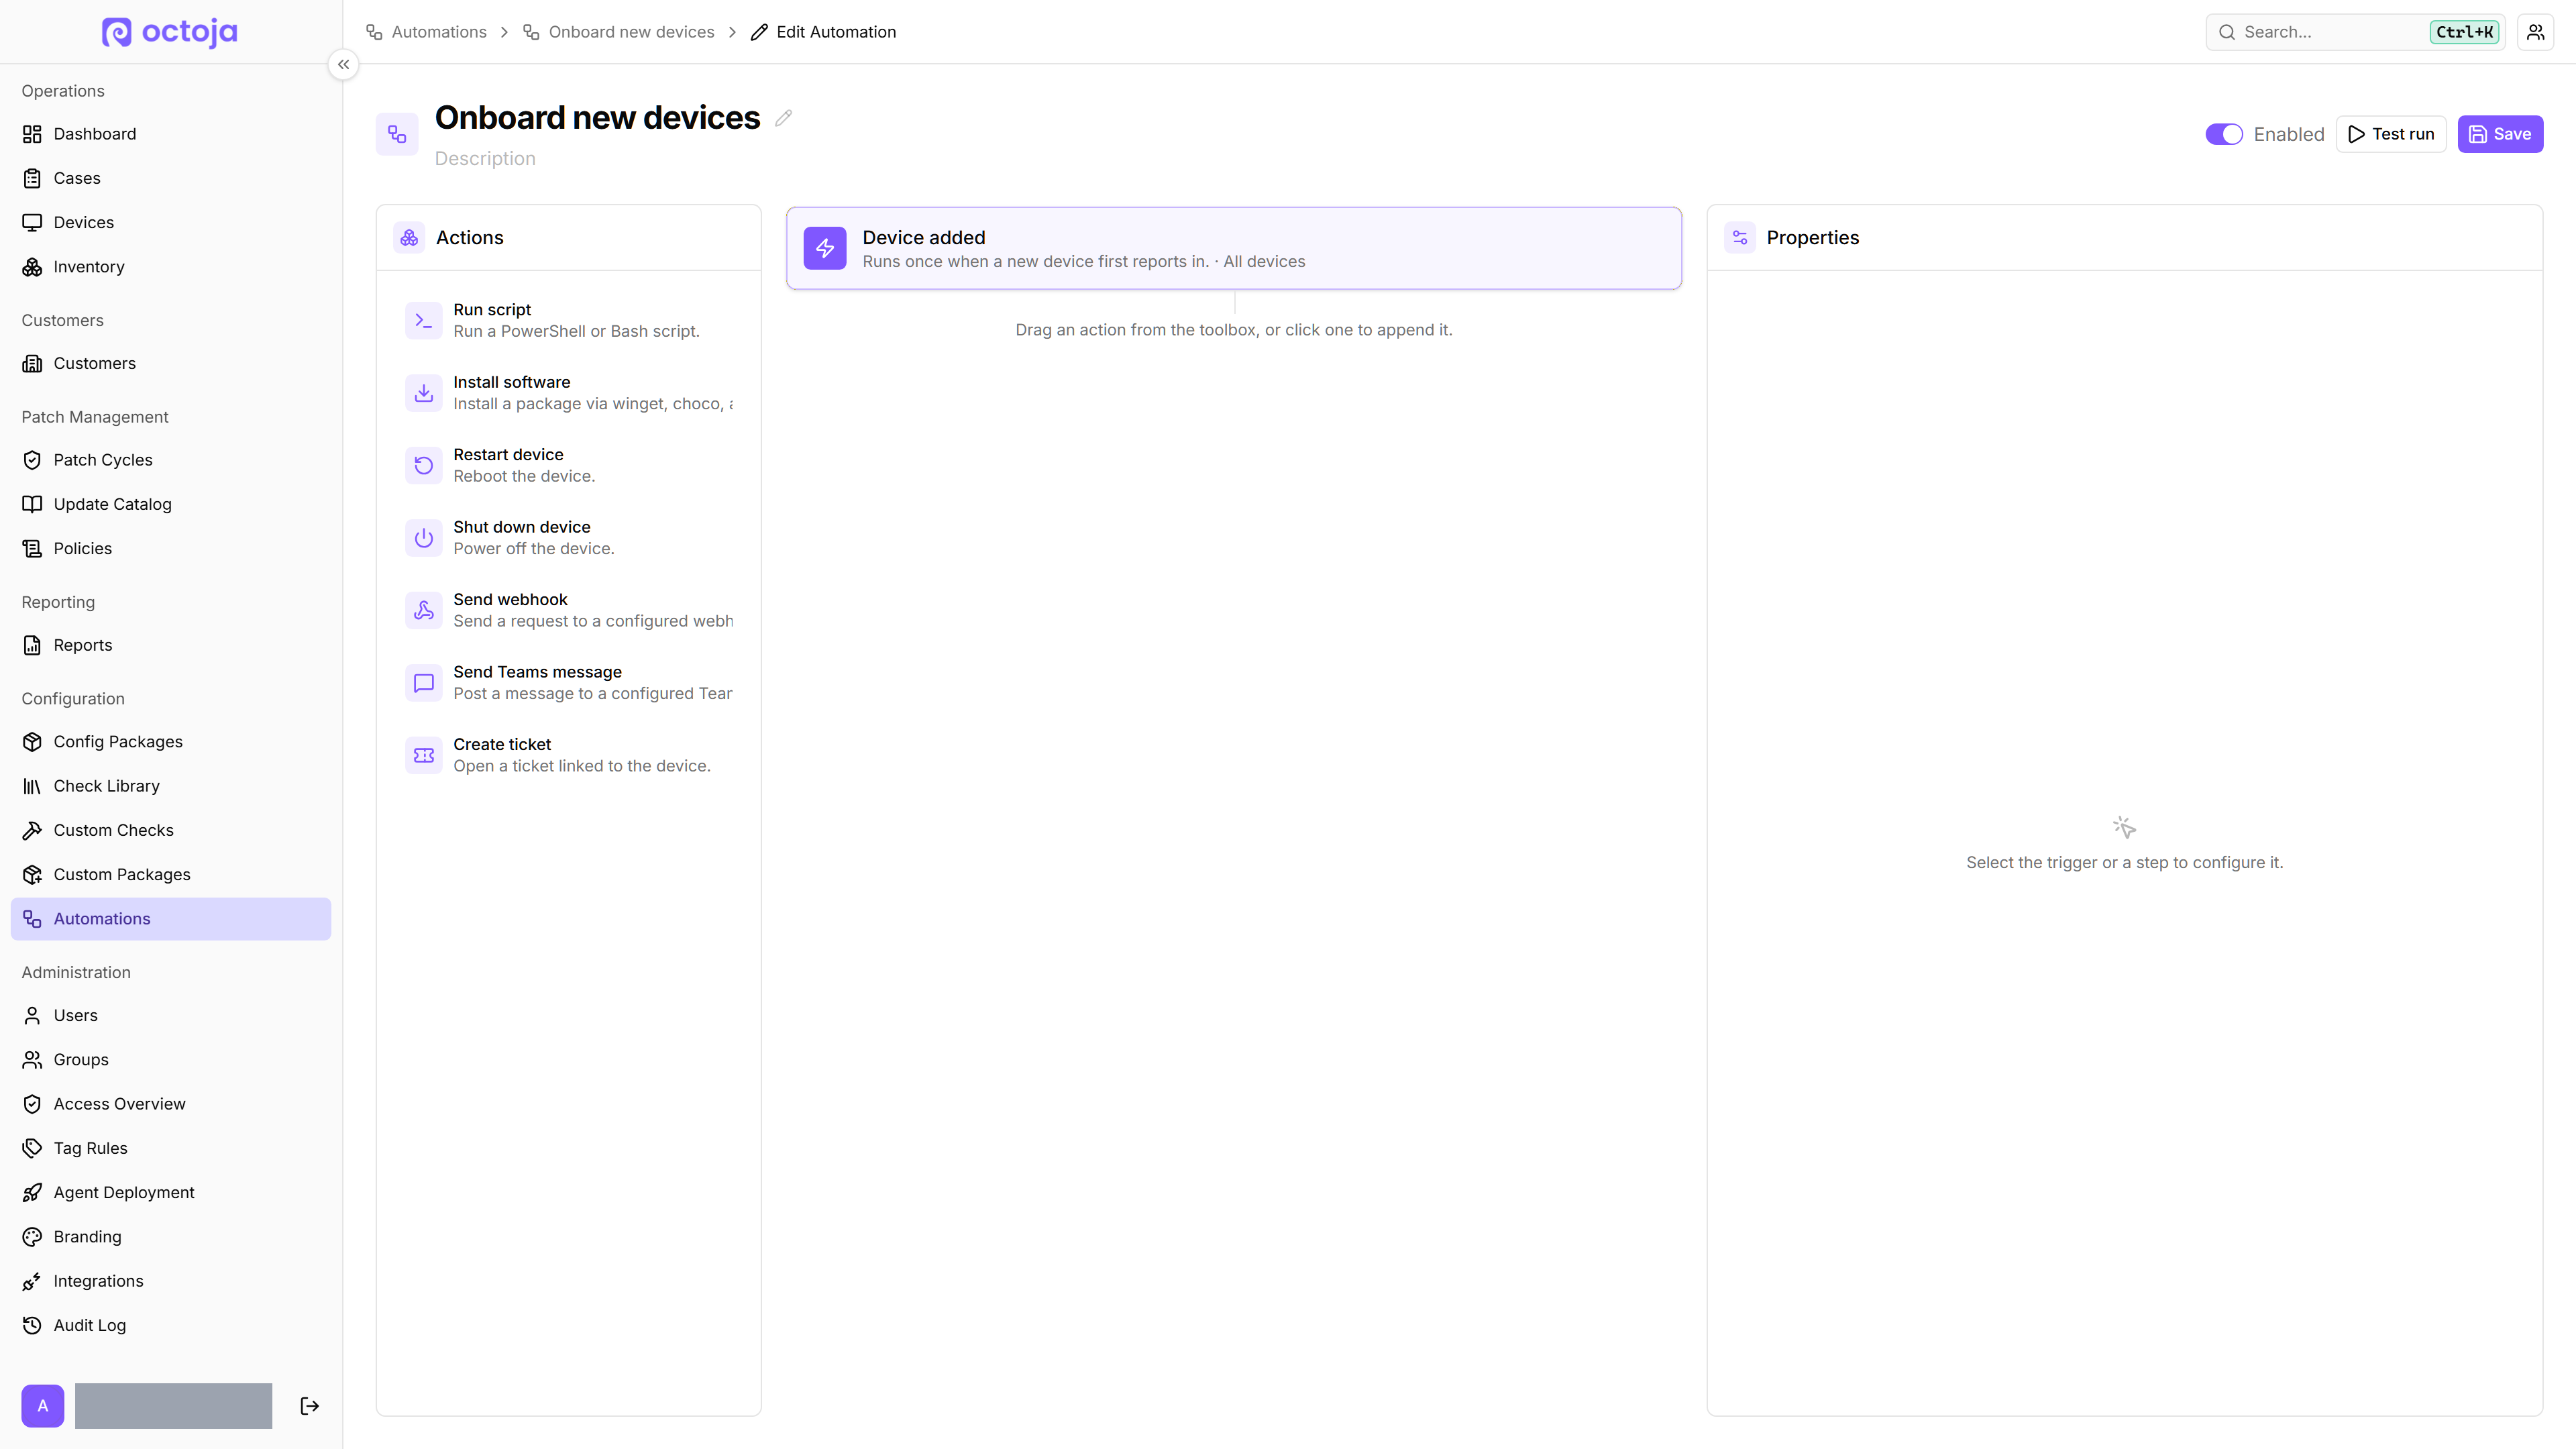
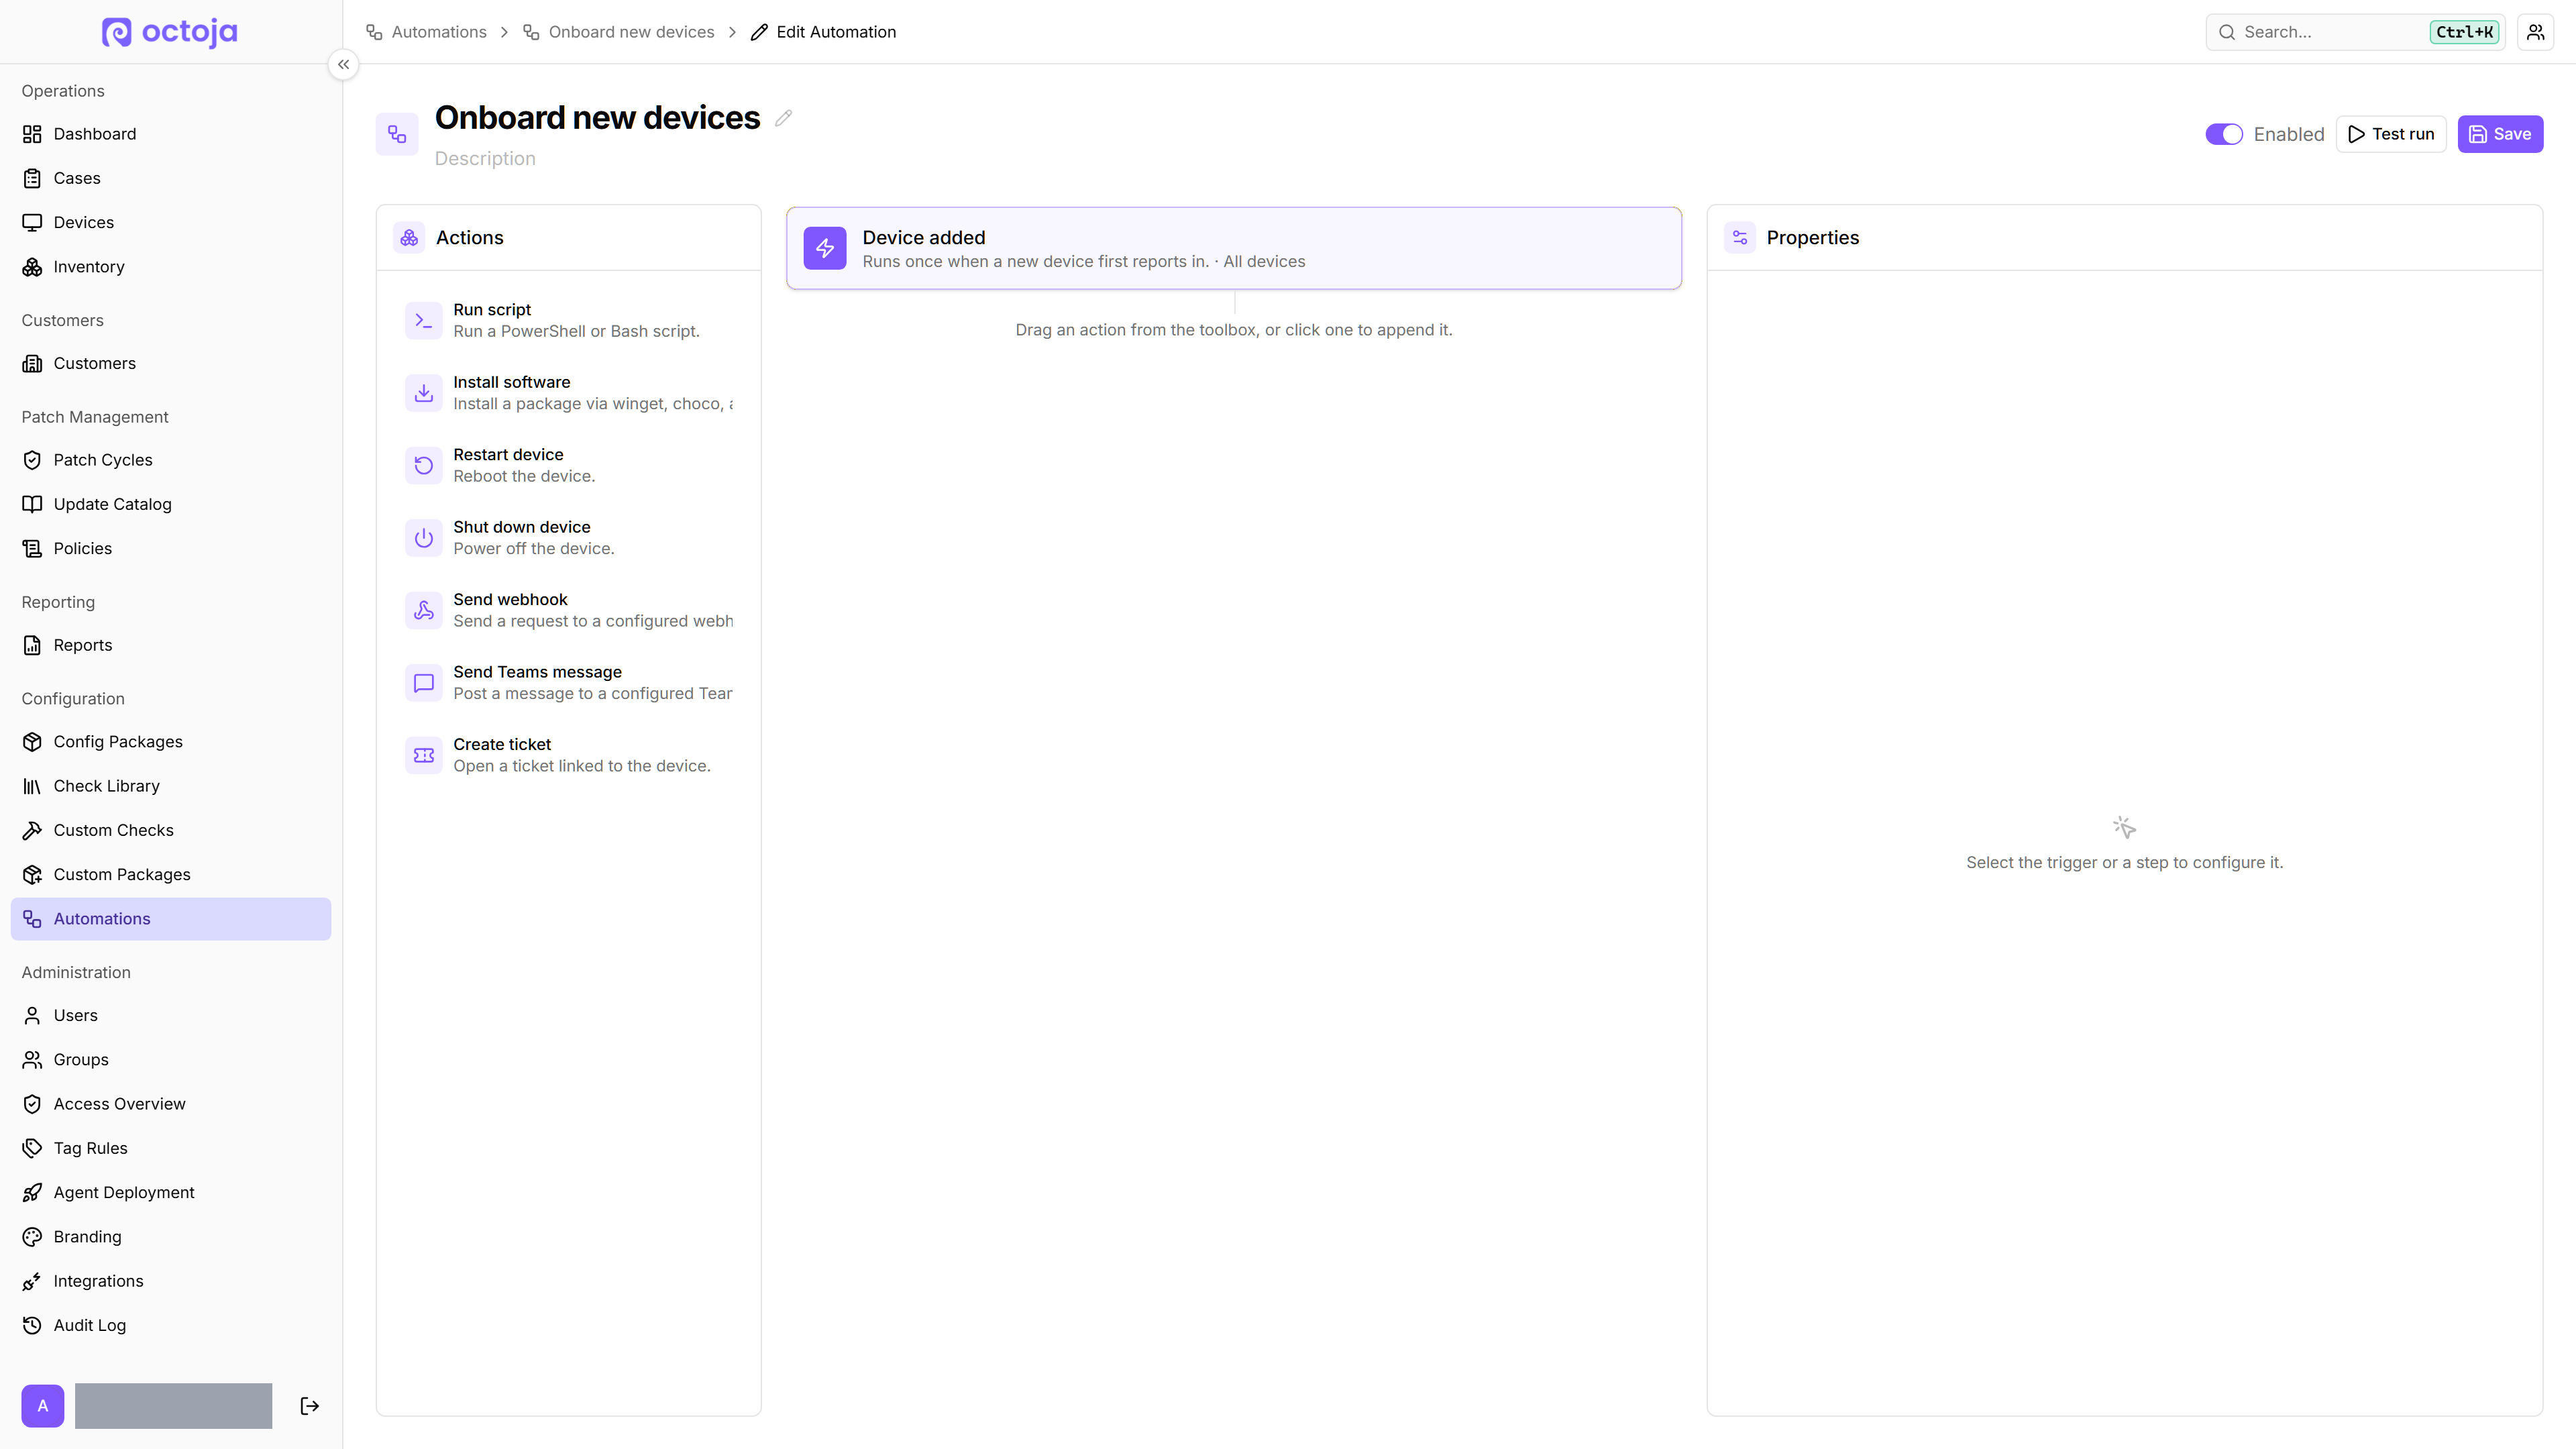
  • Automations: a visual workflow builder — Build multi-step workflows that run across your devices under Configuration → Automations. Drag actions onto a flow canvas, pick a trigger (Device added, on a Schedule, or Manual), and choose which devices it targets, with a live preview of exactly which devices match before you save.
    Automations: a visual workflow builder
  • A library of automation actions — Each workflow runs an ordered list of actions on every matched device: run a script, install software, restart or shut down the device, send a webhook or Teams message, or open a ticket. Add a condition so a step only runs when it should, pass one step's result into the next, and use Test run to try the whole thing against a single device, watching each step on a live timeline before you commit.
  • A self-service app on your team's computers — octoja now installs a small desktop app on each managed device so the people using those computers can help themselves: open support requests and follow the helpdesk's replies, with a desktop notification when an answer arrives. It carries your own branding and a product name you choose, and sits quietly in the system tray, always a click away.
  • A software kiosk for self-service installs — The desktop app includes a Software Kiosk: a curated list of the apps you've approved for that device. People browse or search it and install with one click, so routine software requests never have to reach you, and each entry shows whether it's already installed or has an update available.
  • Audit log — A new admin-only Audit Log page records notable administrative changes, starting with who opened or restricted device enrollment, and when.
  • Resolve a vulnerability in one click — On a Windows device's Vulnerabilities tab, each finding now has a Resolve button: octoja matches the vulnerable product to the installed software, updates or removes it, and re-scans so the finding clears. No more jumping to software management to guess the right package.
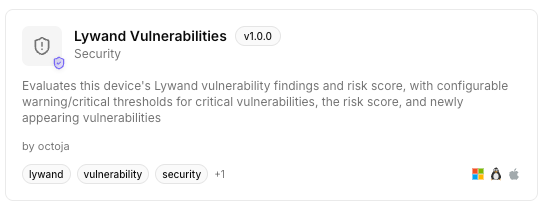
  • New monitoring checks — Fresh coverage joins the catalog: a UniFi Access Point (SNMP) and a UniFi Switch (SNMP) check for full per-device health where the generic UniFi check came up blank, a G DATA Antivirus check running directly on the device, and a server-side Lywand Vulnerabilities check that turns each device's scan results into a monitored alert. The Network Firewall (Appliance) check also gains WatchGuard and SonicWall as SNMP options.
    New monitoring checks
  • c-entron Service-Board integration — Connect c-entron Service-Board so a check alarm automatically raises a ticket on the matching customer and a recovery closes it, with customer matching and ticket type, priority, and category mapping under Administration → Integrations.
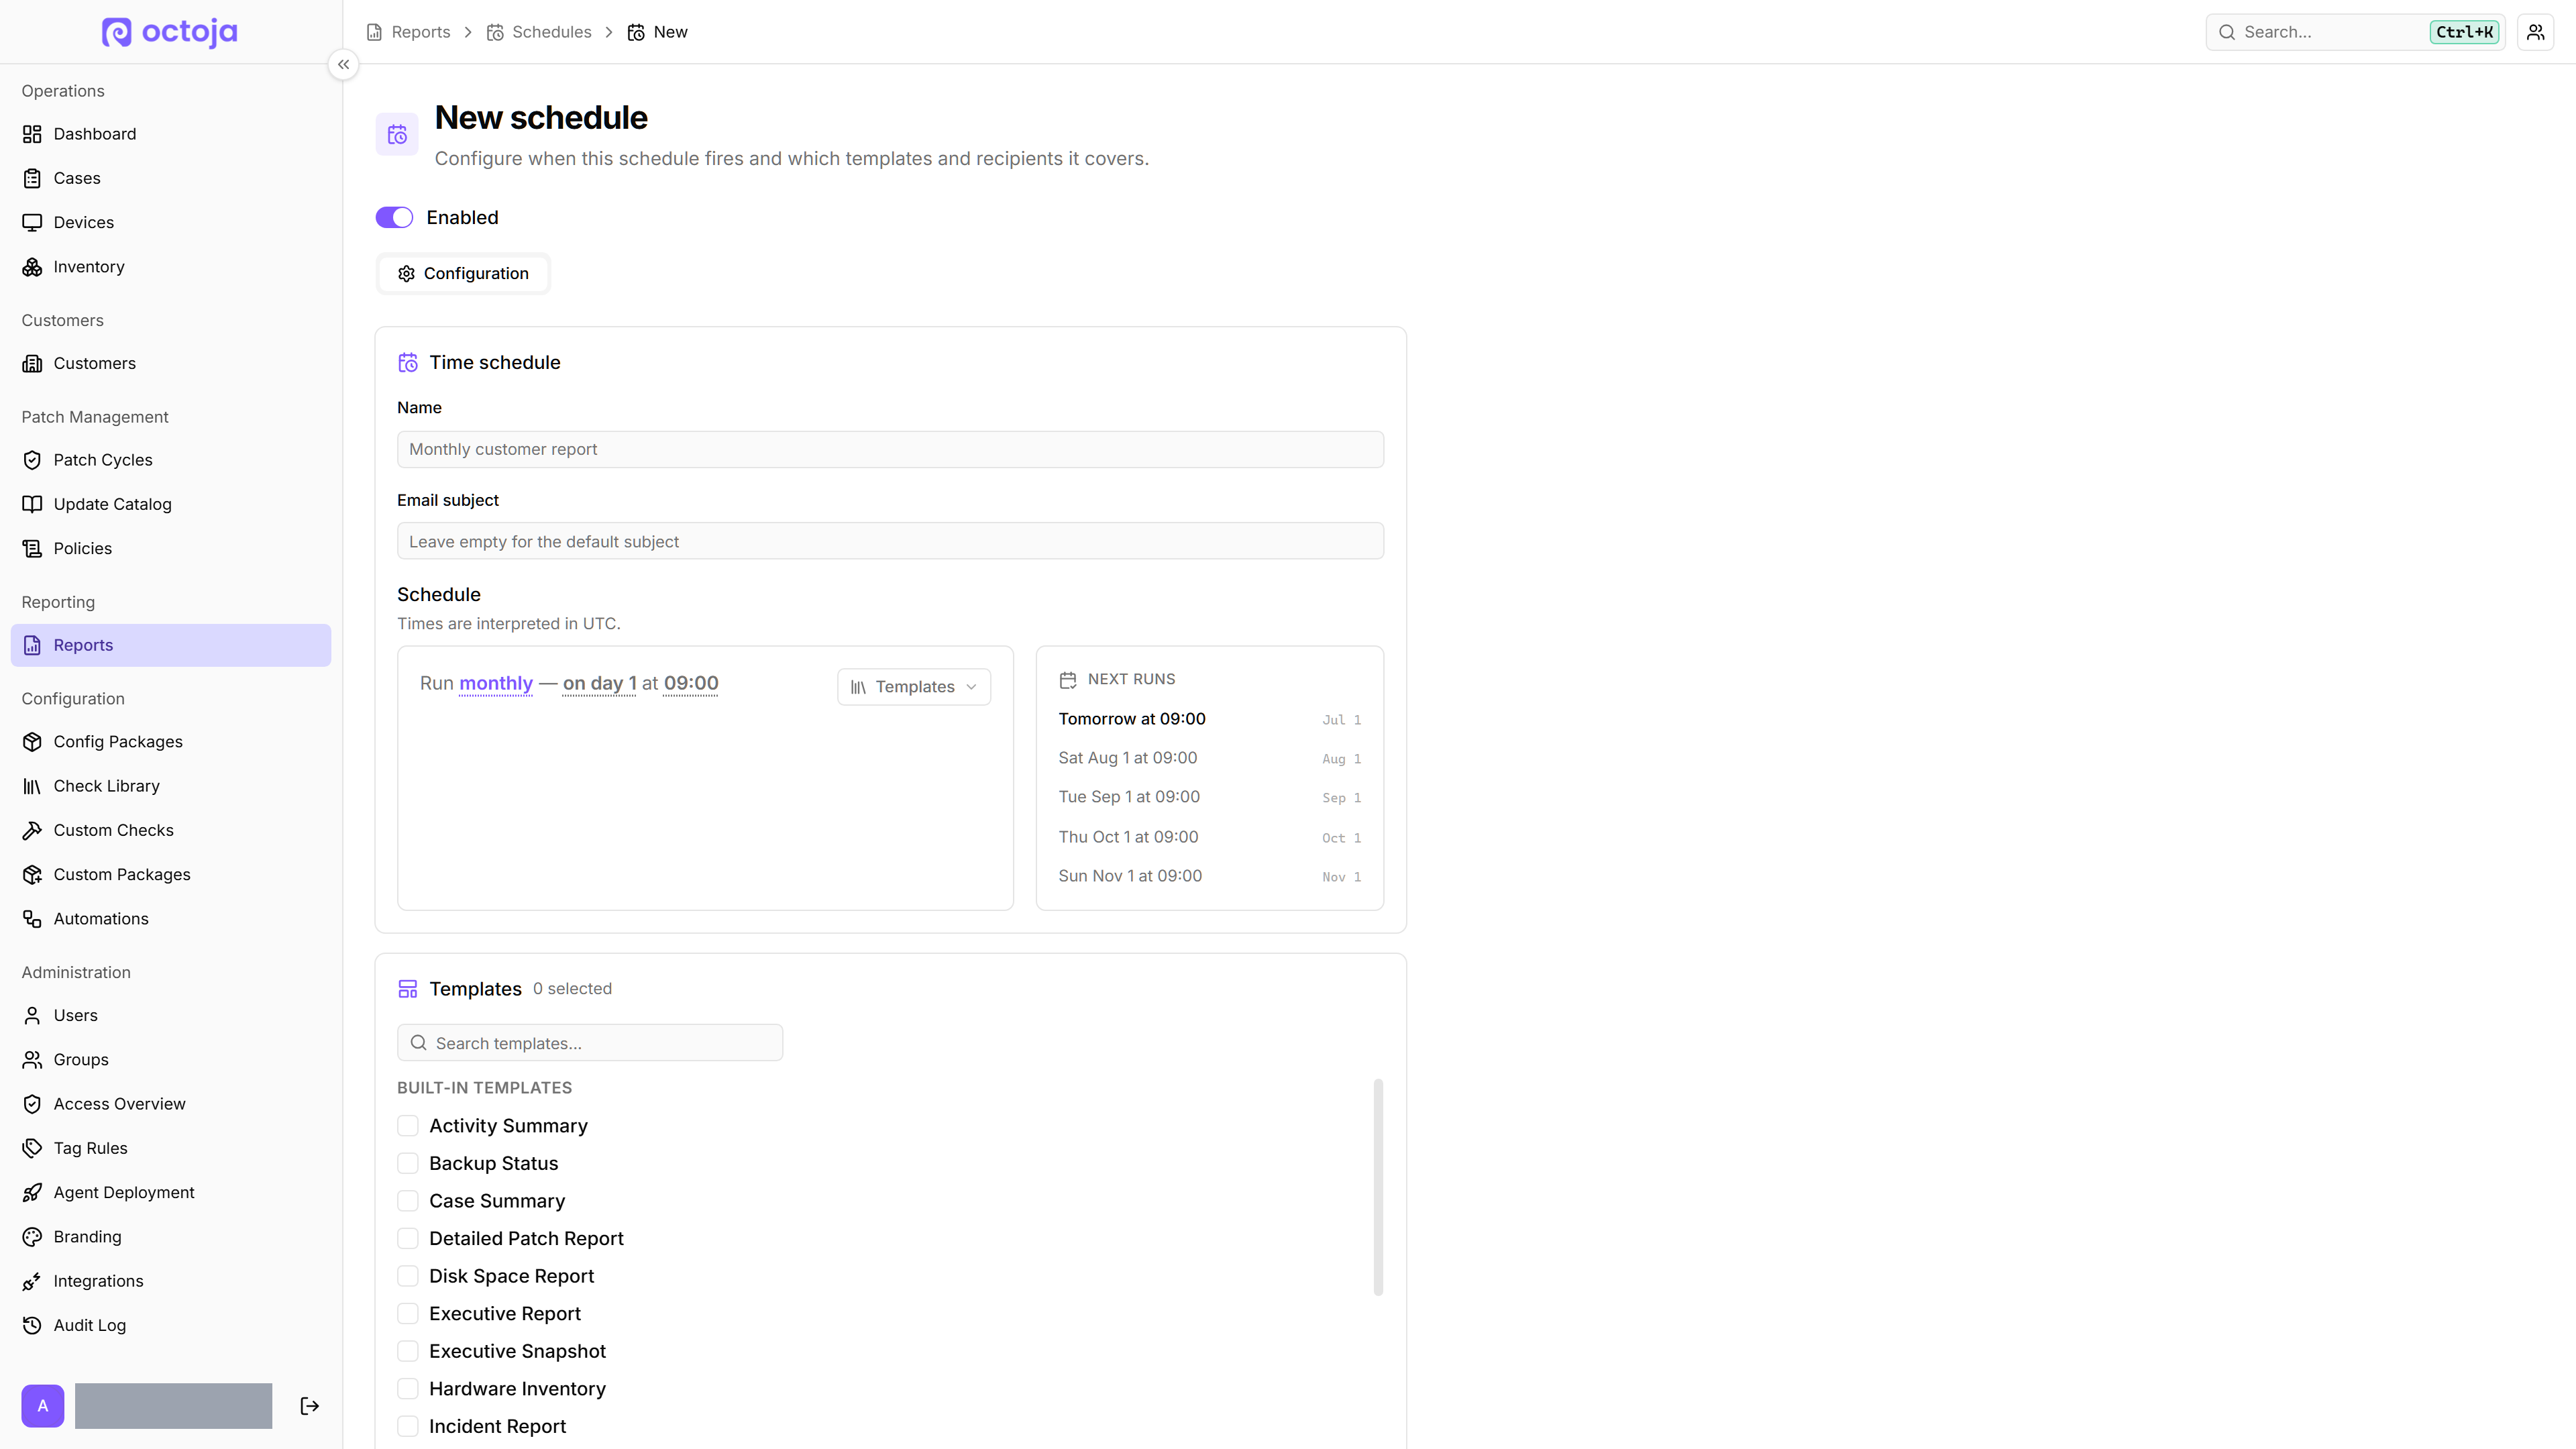
  • Schedule and email your reports — You can now have report PDFs generated and emailed automatically on a recurring schedule. Open Scheduling on the reports page, pick which templates to send and who receives them, and octoja emails the report PDFs to your recipients each time it runs.
    Schedule and email your reports
  • Live network speed, now per adapter — The live Network card on a device page shows throughput for each network adapter separately instead of one combined figure, so the speed you see reflects real traffic rather than being inflated by stacked virtual interfaces. When a device has several adapters you can pick which to watch.
  • Inventory history for every device — A new Inventory History tab shows a timeline of what changed and when: installed and removed software, services, pending updates, local users, and network adapters, plus hardware details as a clear before-and-after, scoped to the last 7, 30, 90, or 365 days.
  • Send a notification to a signed-in user — From a device's action menu you can send a message straight to whoever is signed in on that machine. They get a pop-up they must acknowledge, and you immediately see whether it was shown, whether no one was signed in, or whether the device was offline.
  • Digital signature for every service — The Services tab on a device gains a Signer column showing who signed each Windows service's program file and whether that signature is trusted, so you can spot unsigned or tampered service files across your fleet at a glance.
  • Ask the user before you connect — You can now require the signed-in user to allow each remote desktop session before it starts. A permitted technician can still connect without consent in an emergency by entering a reason, which is always recorded. While the prompt is up, the connecting screen now tells you it's waiting for the user to approve, instead of looking like it's stuck waiting for the picture.
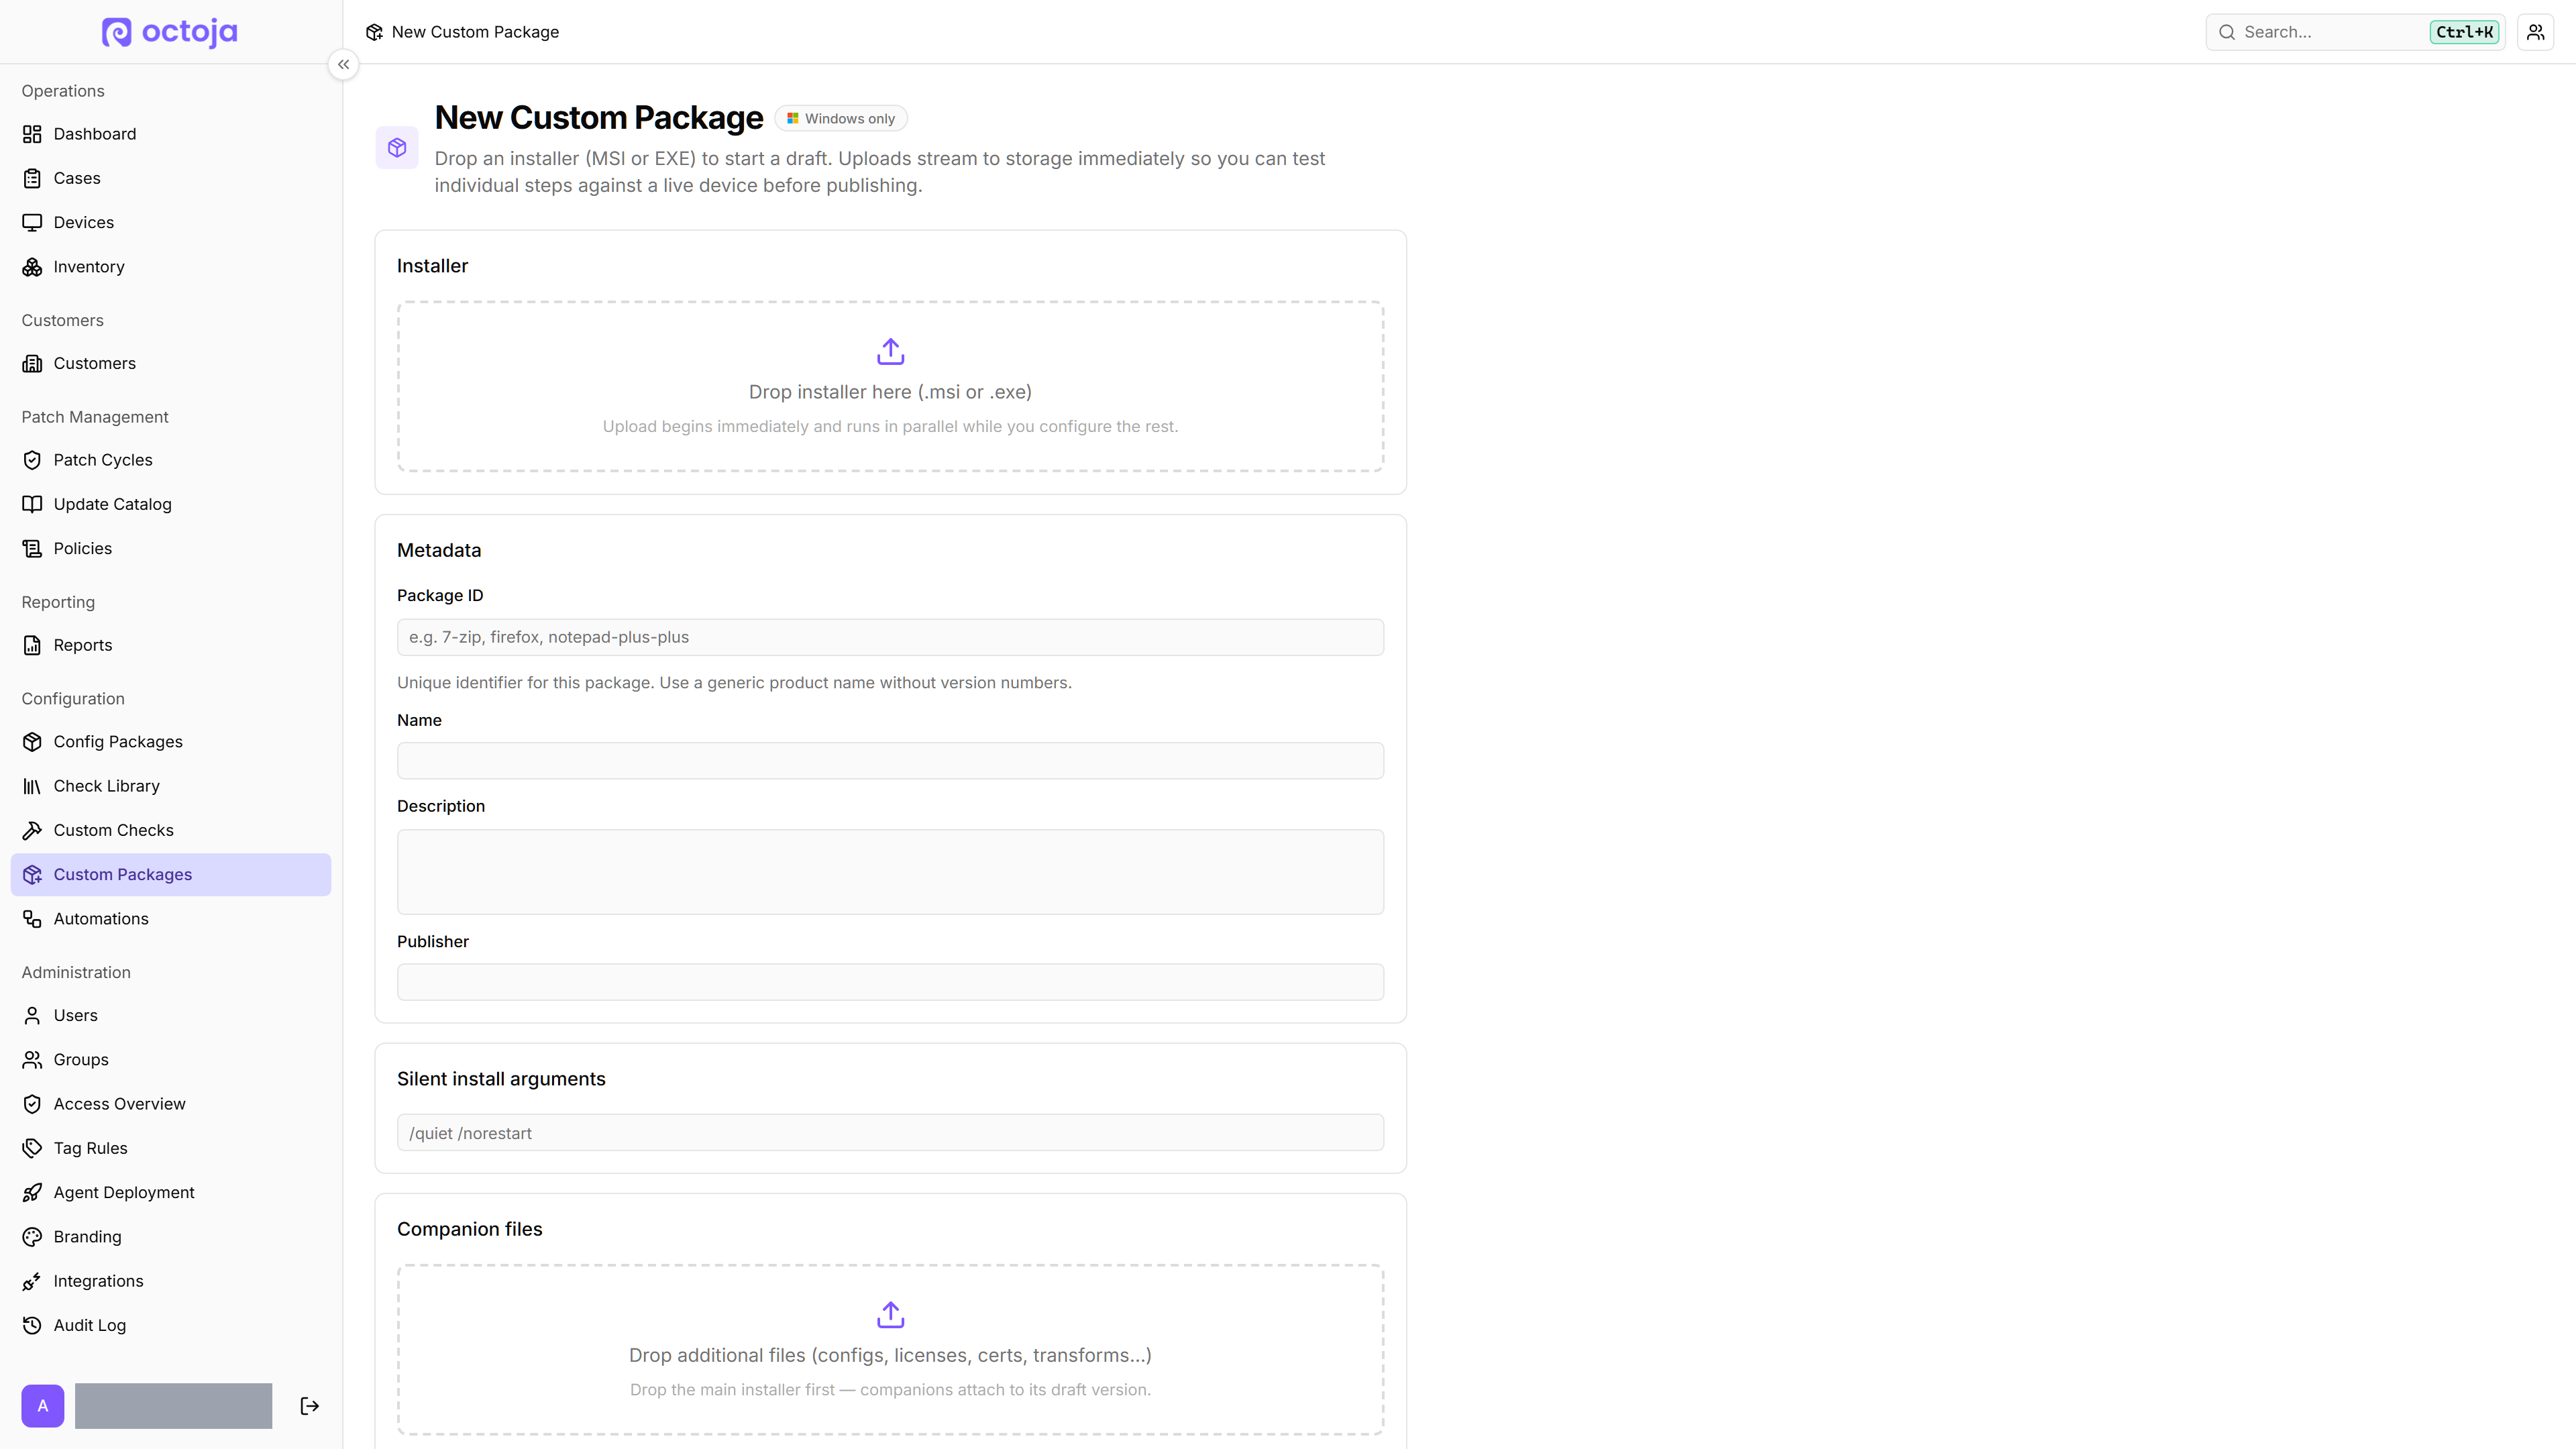
  • Deploy .exe installers as custom packages — Custom packages now accept .exe installers, not just .msi. Drop an installer into the New Custom Package wizard, octoja reads its details automatically, and you can test it live on a device, publish it, and choose how it uninstalls.
    Deploy .exe installers as custom packages
  • Quiet hours for each alert channel — Each channel in an alert configuration can be limited to a weekly window of weekdays and times, so you're only paged when that channel should be active. Switch on Catch up missed alerts and an alarm that would have fired off-hours is delivered once the window reopens, as long as the issue is still ongoing.
  • Starter alert configurations — A fresh octoja instance now ships with four ready-made alert configurations (Immediate – Critical, Standard, Sustained Issue, and Critical – Multi-stage), so you have sensible escalation profiles from day one. Rename, edit, or delete them freely.
  • Finer-grained permissions — Several capabilities are now their own permissions you can grant independently: opening a device's terminal (per device), creating brand-new custom tags, and managing the custom-check catalog and check repositories separately from the rest of monitoring. octoja now also matches each user's view to those grants — a device's buttons, the global search commands, and the device lists only offer the actions that user's group allows (Remote Desktop, Terminal, File Browser, Software Management, and so on), instead of showing an action that fails when clicked. Existing administrator groups keep these automatically.
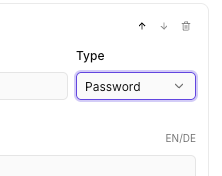
  • Password inputs in your own checks — When you build a check in Custom Checks, you can now mark an input as a Password so a secret like an API key is masked while you type it.
    Password inputs in your own checks
  • Manage your single sign-on logins yourself — Your profile page now has an Authentication section where you can link a single sign-on account to your own login (Link Account), unlink one you no longer use, and even remove your password so you sign in through single sign-on only. octoja always keeps at least one way for you to sign in, so you can't lock yourself out.
  • Lock a device automatically after remote desktop — A new Auto-lock after remote desktop agent setting locks a device the moment a remote desktop session ends, so a machine never sits unlocked after you disconnect. Set it as the default for matched devices in a configuration package or per device, and a technician can still override it for a single session.
  • Manage your agent settings across the whole fleet — Config packages now carry an Agent tab where you switch on four agent settings for every device a package matches — Require user consent for remote desktop, Show agent in system tray, Software kiosk enabled, and Ticketing enabled (which lets people on the device raise support cases). A device gets a setting if any of its packages turns it on, so you set the rule once and it follows your fleet. Need a different answer on one machine? Open Agent settings from that device's action menu and set any setting to Default (from its packages) or Override it On or Off, just for that device.

Improved

  • Sort, filter, and export across every table — Tables throughout octoja (users, customers, groups, the access overview, inventory, Cases, patch policies and cycles, integrations, and more) now share one layout. Click a heading to sort, drag to resize, reorder or hide columns, search the rows, and export the current view as CSV.
    Sort, filter, and export across every table
  • Antivirus checks now run on the device — The Bitdefender, SentinelOne, ThreatDown, and Sophos checks now read protection status (agent health, real-time protection, definition age, and threats) directly on each device instead of polling the vendor's cloud console. You no longer need cloud credentials or tenant matching for these checks, most let you set your own warning and critical thresholds, and existing assignments keep working as they switch over.
  • Group-scoped access reaches further — When a user's access is limited to certain customers, that limit now also covers patch policies and cycles, the update catalog, and configuration packages, so they only ever see and change items belonging to their own customers.
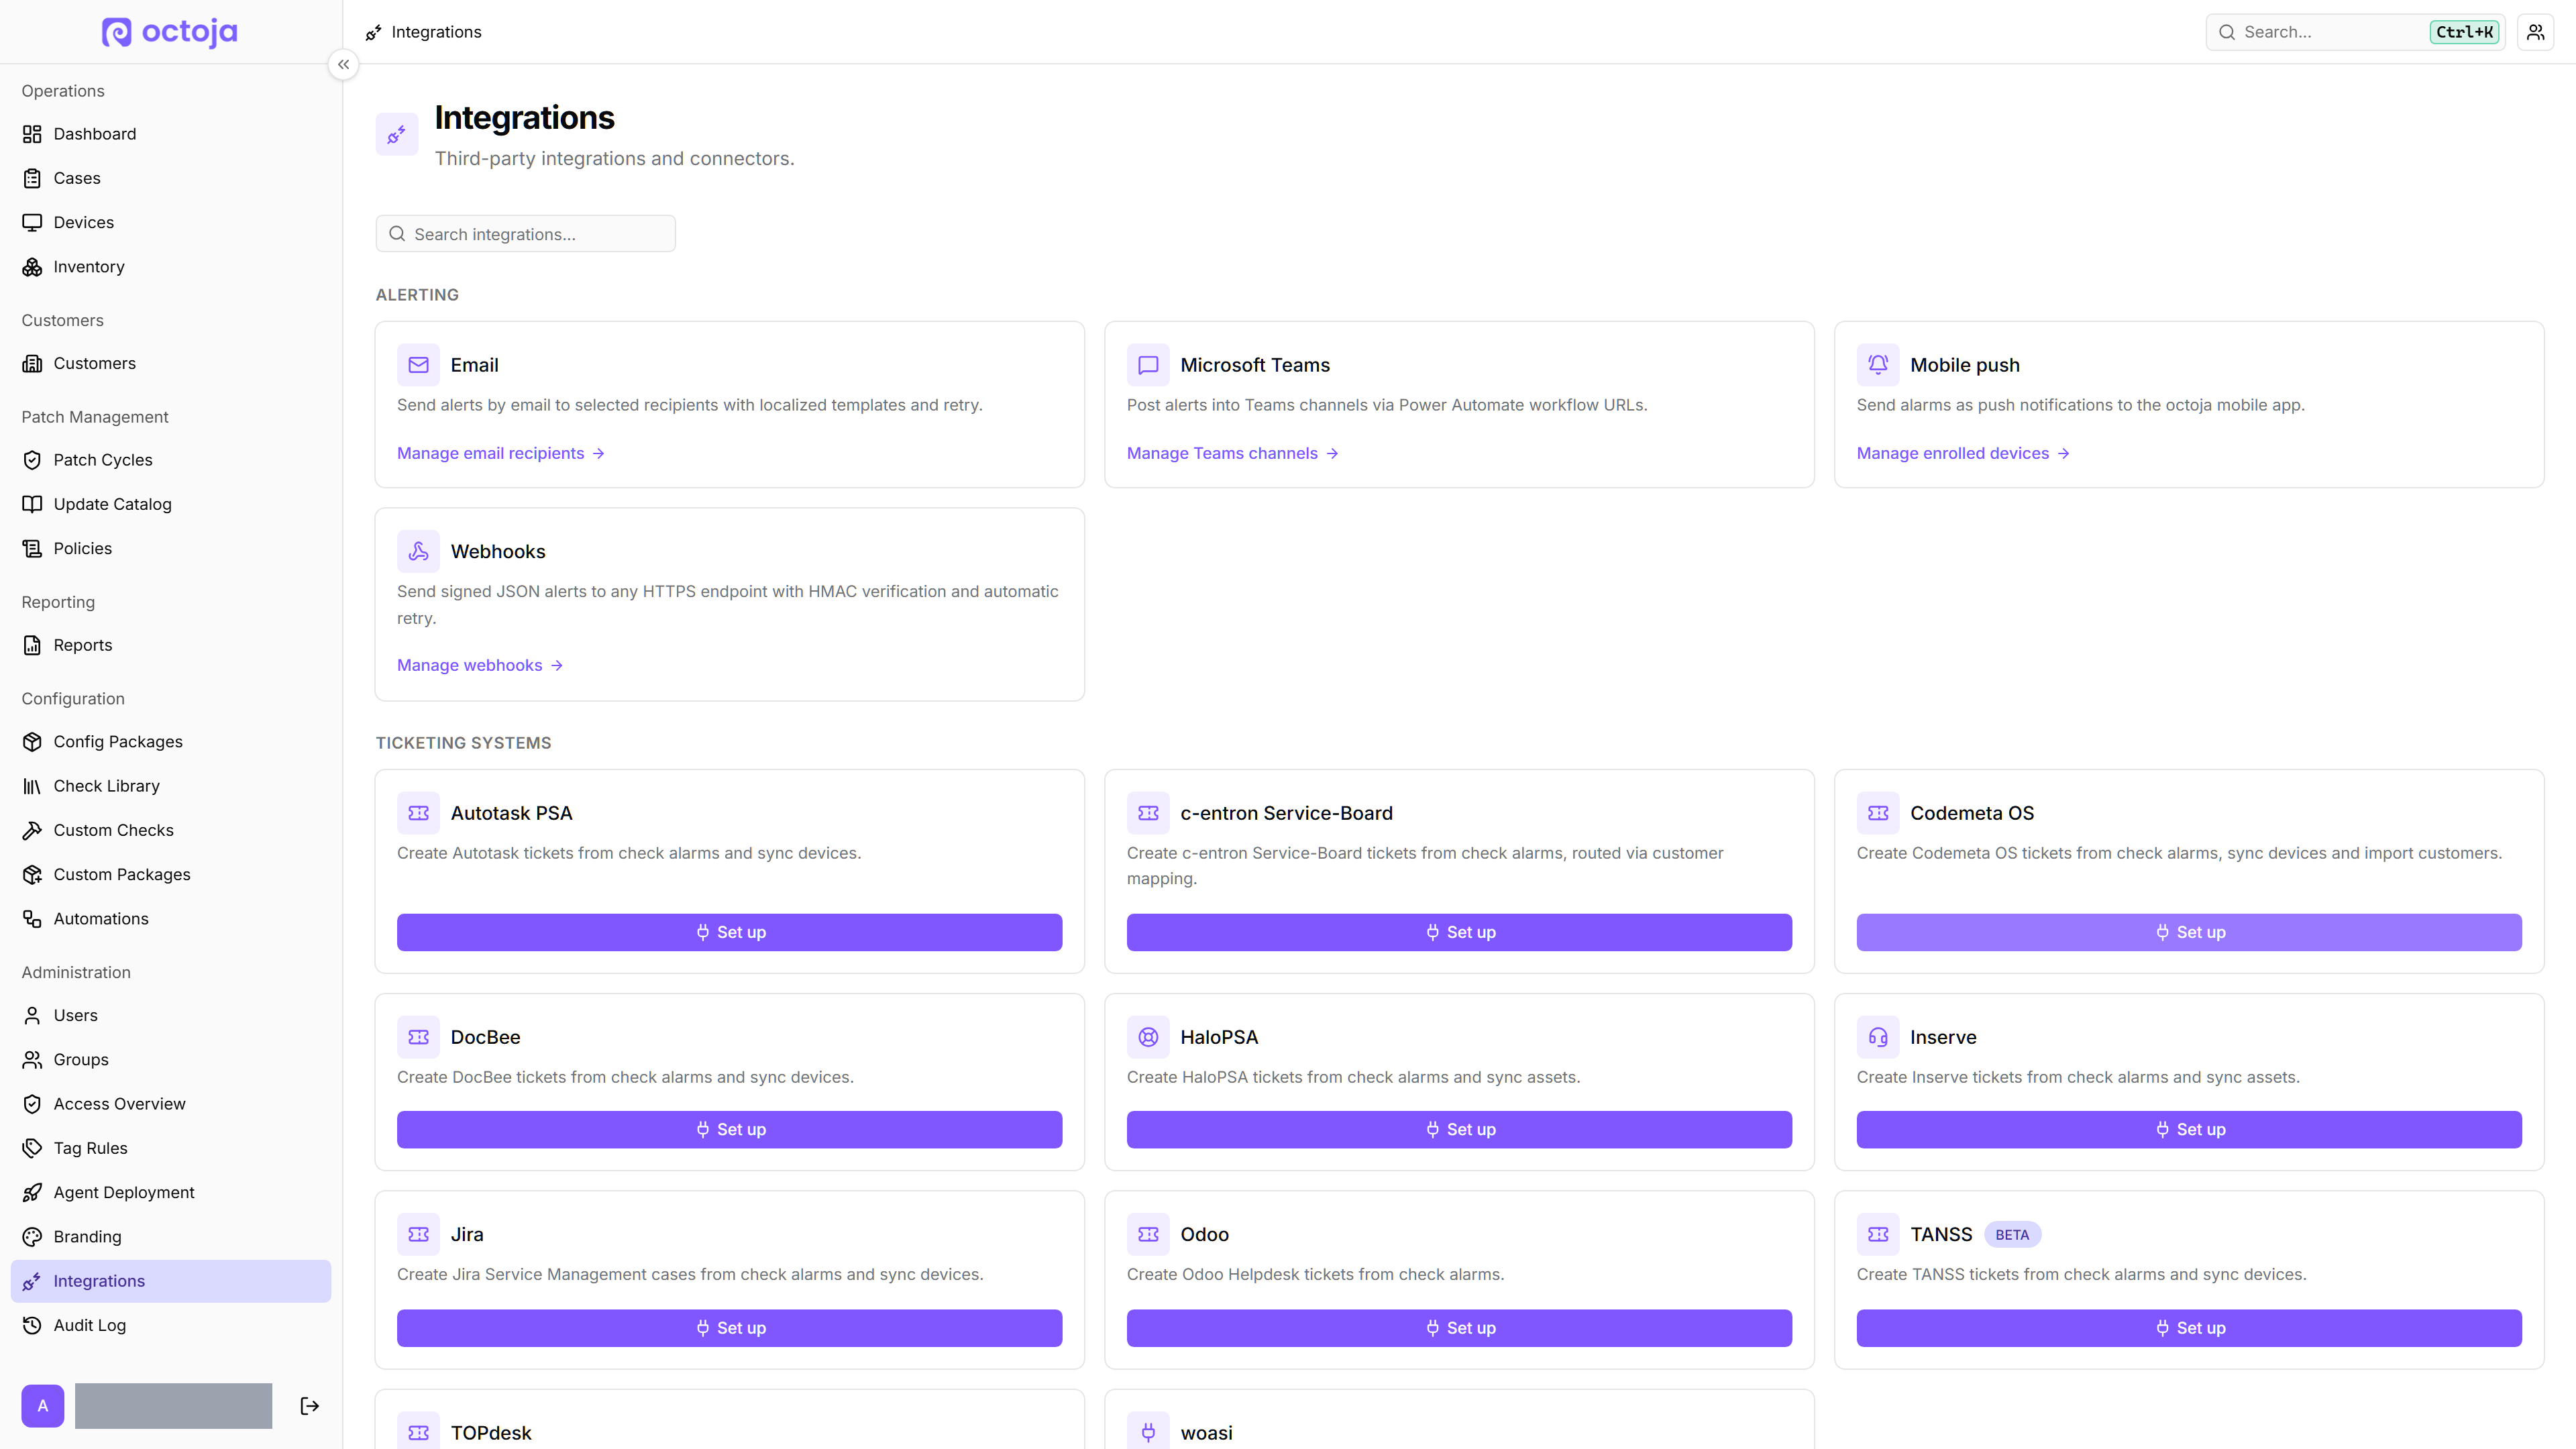
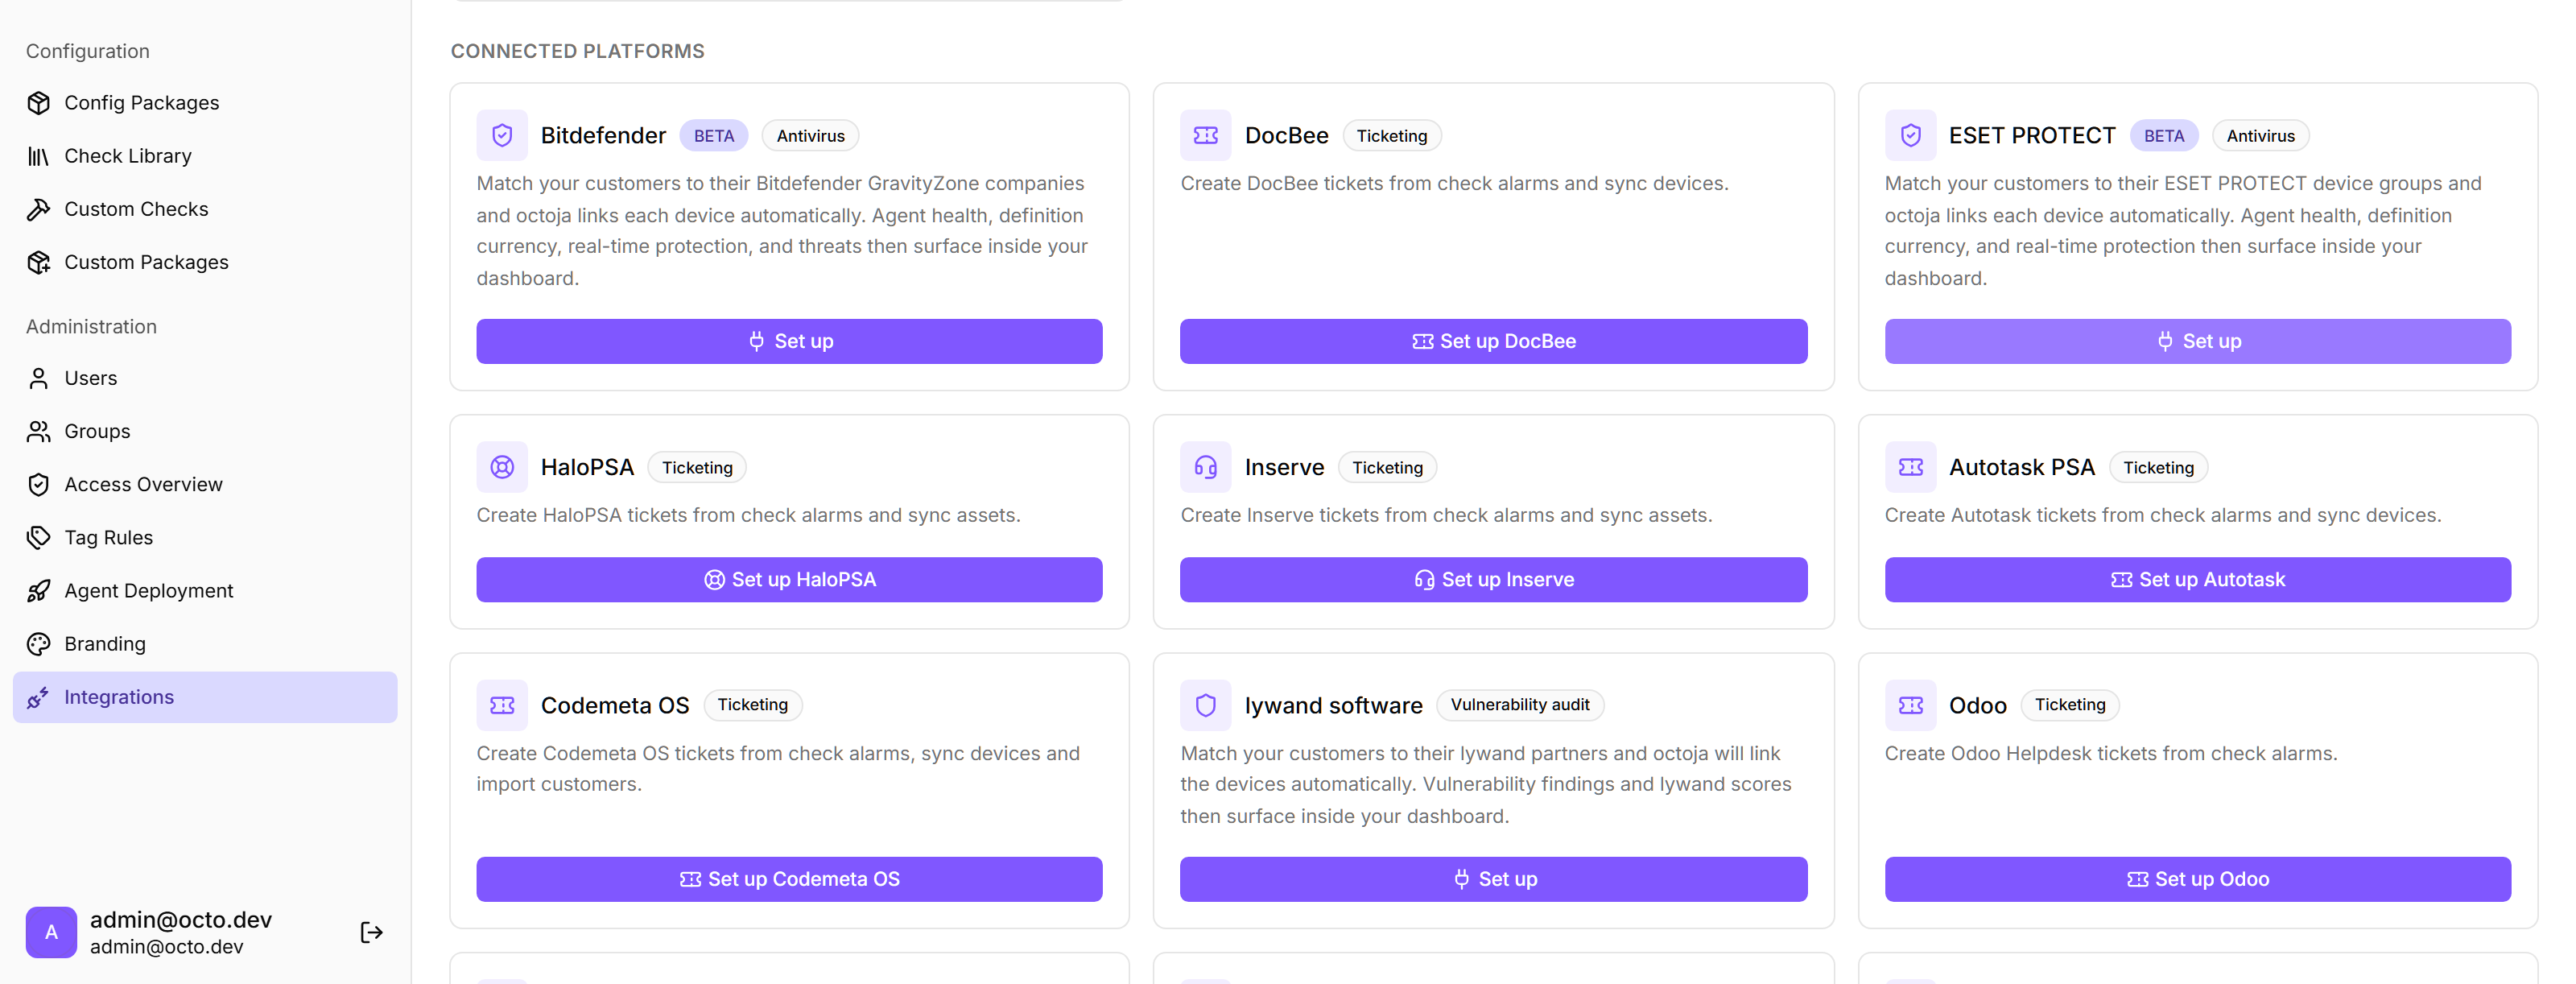
  • A clearer integrations page — Administration → Integrations now groups connectors into clear sections, including Ticketing systems and Other platforms, each sorted alphabetically, and adds a search box so you can jump straight to the one you need.
    A clearer integrations page
  • Richer report widgets — Check widgets in the report builder now show the check's name on the card, and you can narrow any check widget to specific devices or statuses. A new per-device check-history widget plots each device's own history chart inside a report, and check output now renders exactly as it does on the device page.
  • Full per-job detail in Veeam results — The Veeam Backup & Replication check now shows ten more details for each job (last run, state and progress, backup type, app-aware processing, compression, the run's bottleneck, encryption, and more), so you no longer have to open the Veeam console to see them.
  • SMART check watches every disk by default — Adding a SMART Disk Health check now starts with Monitor all disks switched on, so a new check covers every drive without you typing any device paths.
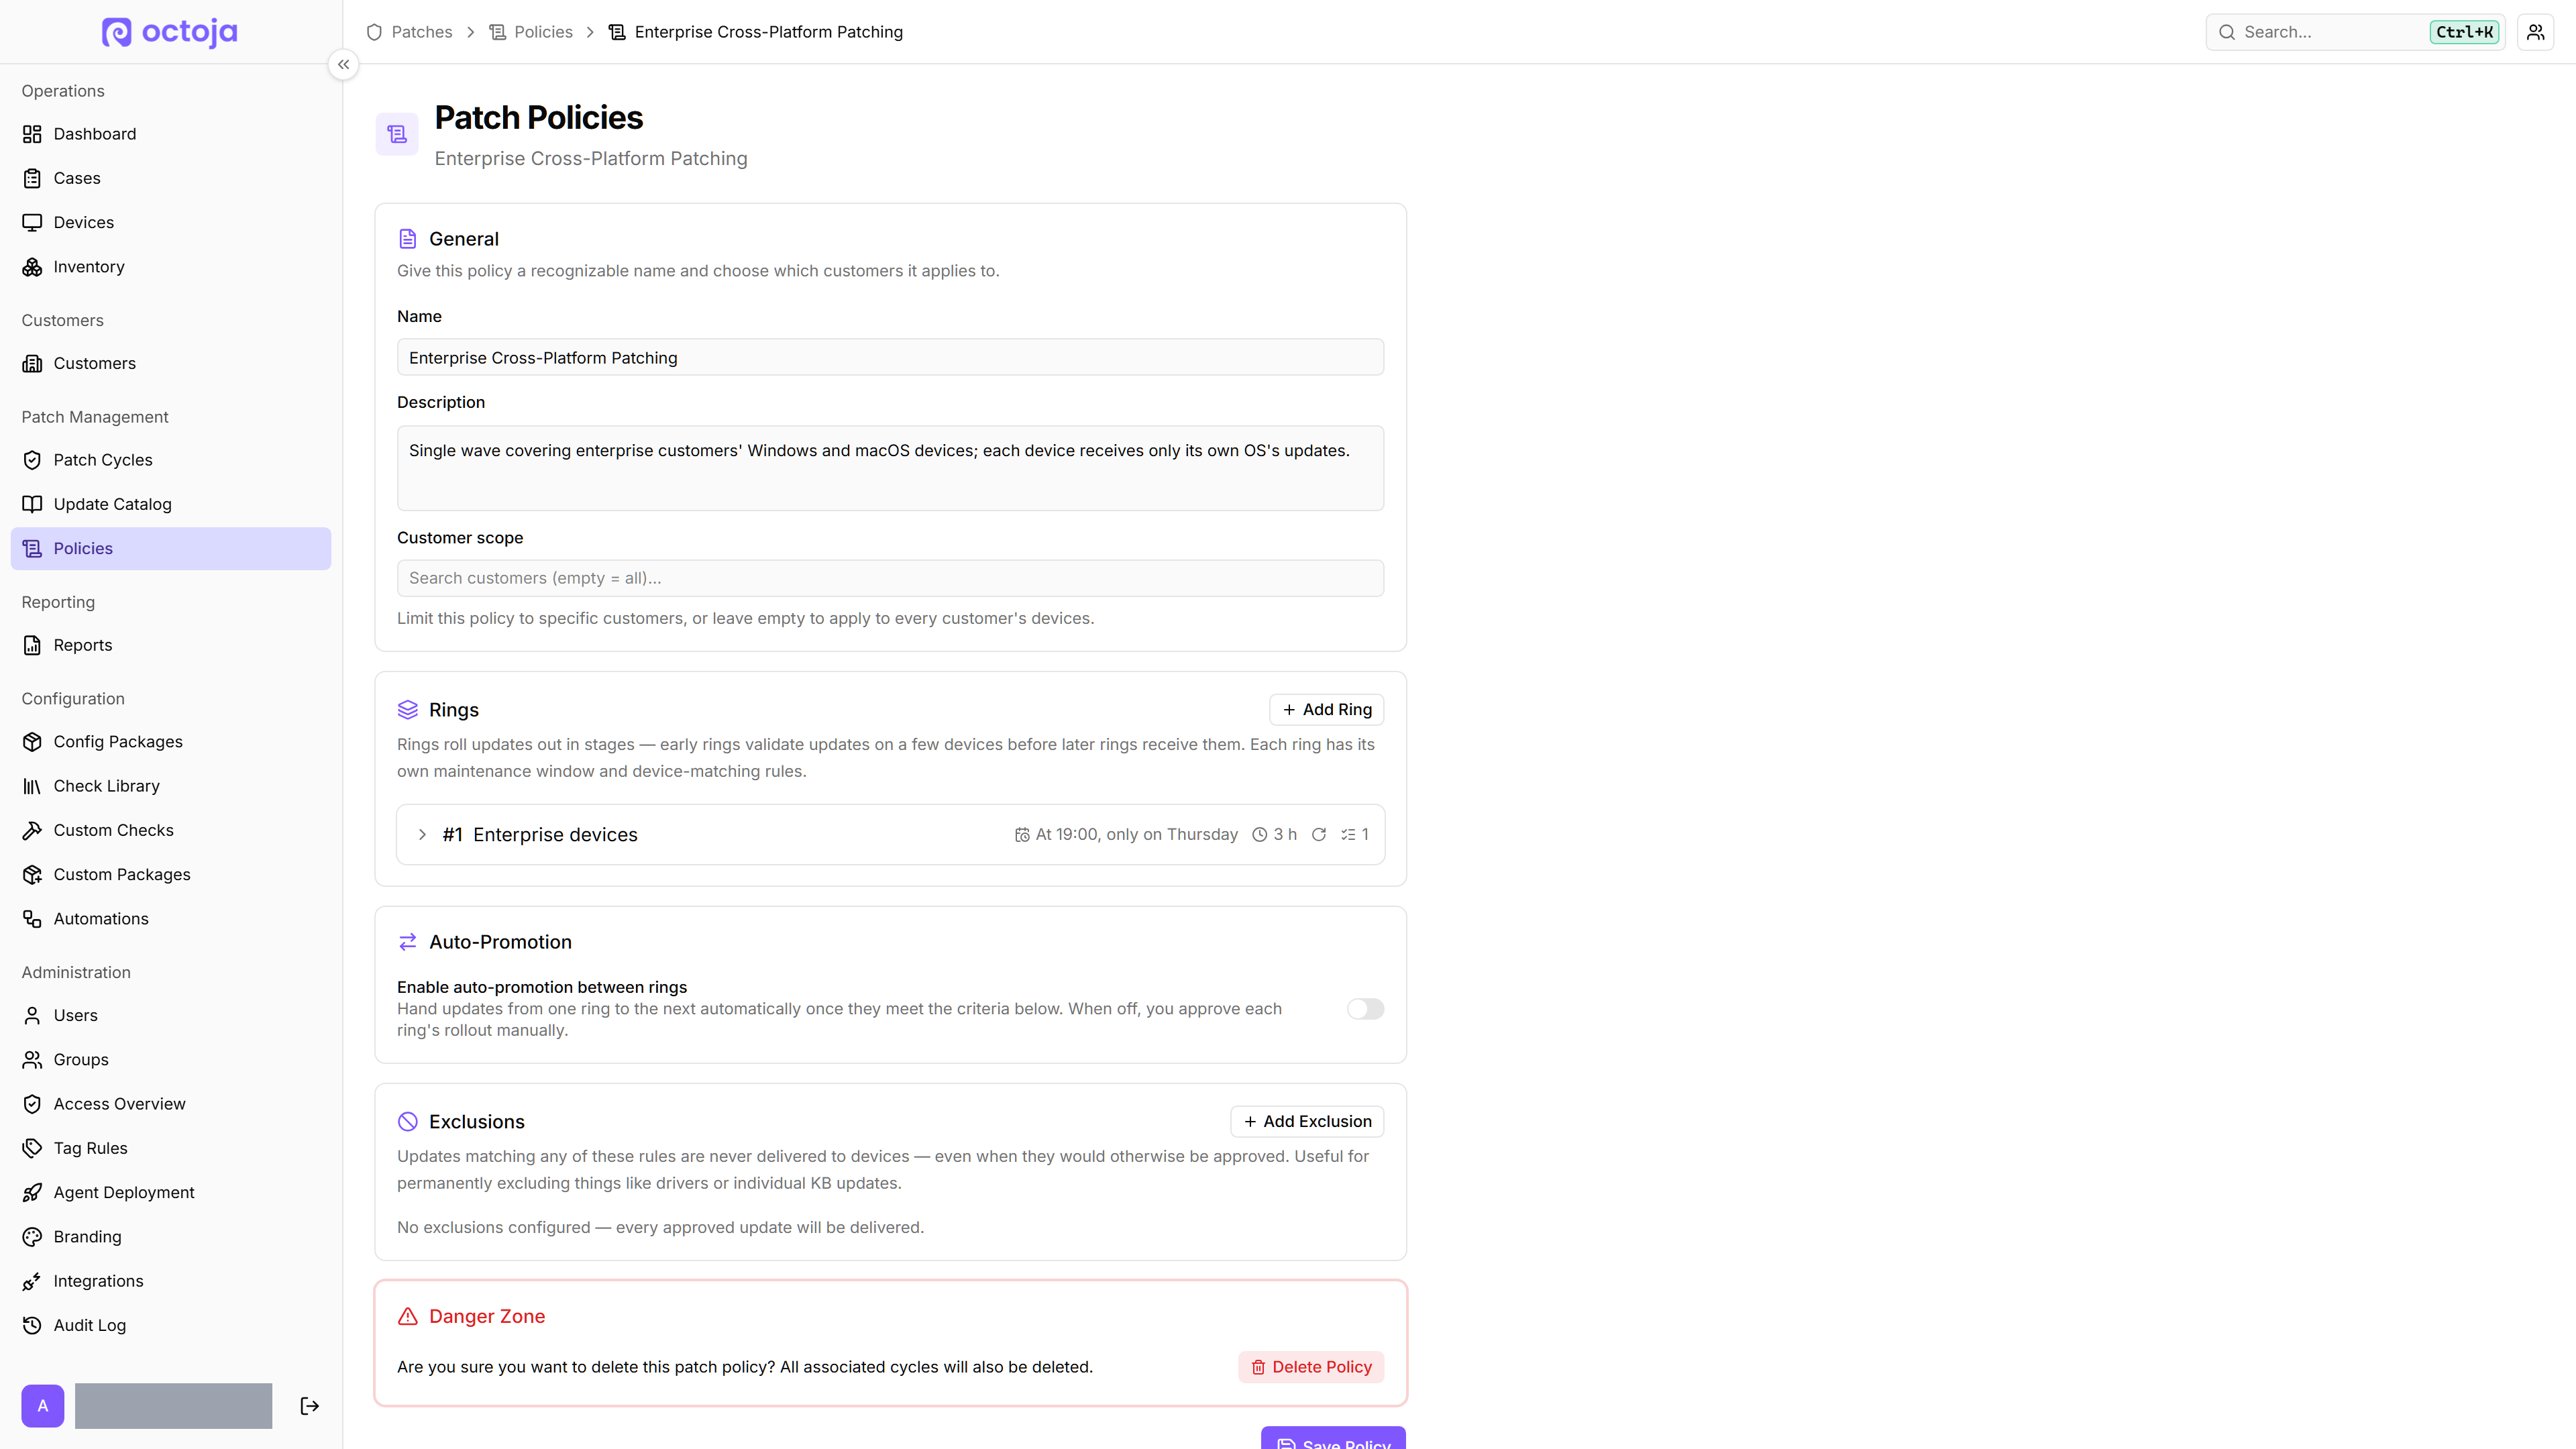
  • Redesigned patch policy editor — The patch policy editor has a cleaner, card-based layout with at-a-glance ring summaries, and creating a policy is now a quick dialog that only asks for a name and drops you straight into editing.
    Redesigned patch policy editor
  • Software installs for all users by default — Deployments now install for every user of the device by default, so unattended rollouts succeed even when no one is signed in. Choose to install for the signed-in user only when a package belongs in just their profile.
  • A faster Install Software dialog — Opening Install Software on a device now loads quickly instead of stalling while it gathers the device's installed packages; octoja warms the list the moment you hover the Install Software button.
  • Alert timestamps in local time, not UTC — The time on Teams alert cards and alert emails now shows in the instance's configured time zone with the correct offset (default Europe/Berlin; your provider can set it), so recipients no longer have to convert from UTC in their head.
  • Only connected ticket systems appear as channel types — When you add a channel to an alert configuration, the type picker now lists a ticketing system only if it's actually connected, instead of showing every possible integration.
  • Lywand at a glance — The Vulnerabilities tab now shows when a device was last scanned, and the customers overview gains a colour-coded A–F security rank column you can sort by, so you can read your whole fleet's posture without opening each customer.
    Lywand at a glance
  • A cleaner, sticky device page — The device detail page got a visual tidy-up (consistent cards, proper empty states, and live metrics that no longer wrap awkwardly on narrow screens), and the device's name and action buttons now stay pinned to the top as you scroll.
  • See on the device when a technician is connected — The on-device app now shows a clear indicator while someone is connected remotely, so the person at the machine always knows a session is active.
  • Repeat a schedule every few hours — Deployment schedules gain an interval mode, so you can run a software rollout every few hours instead of only daily, weekly, or monthly.
  • Clearer error messages — Error messages now appear in your own language instead of occasionally falling back to English, and unexpected failures include a copyable reference code you can quote to support.
  • Refresh a patch cycle on demand — A new Refresh now button on draft and approved patch cycles re-checks the cycle against your current devices right away, picking up newly pending updates and dropping ones that no longer apply, while keeping every decision you've already made.
  • Alarm-config editing limited to alert managers — The buttons to add, edit, or delete alert configurations now appear only for users who can manage alerts, with a clear message if you lack the permission instead of a generic error.
  • A more antivirus-friendly Windows agent — The Windows agent now does its update, inventory, and check work in a way that security tools are far less likely to flag, so it's less likely to be blocked or quarantined.
  • Create a site while setting up a token — When you pre-assign a customer while configuring agent deployment or creating an installation token, you can now add a new site for that customer right there with the Add site button, instead of leaving to create it first. The site field appears as soon as you pick a customer, so even a customer's very first site can be created in the flow.
  • A consistent Save button and Ctrl+S on every settings page — The Save button now sits in the same place — at the top of the page — across every edit, profile, and integration settings screen, and pressing Ctrl+S (Cmd+S on a Mac) saves from anywhere on the page. Saving with the keyboard now always applies the value you just typed, so changes like tag rules and branding no longer quietly revert.
  • Smarter SMART disk monitoring — A SMART Disk Health check on a device with no SMART-capable disk (a VM or hardware-RAID box) no longer sits at a permanent Warning, so it stops nagging you for a state that is perfectly normal. And if a disk a device used to report suddenly disappears, octoja now raises a Critical alert reading “SMART disk is no longer detected — it may have failed or been removed”, catching a drive that died or was pulled.
  • See your version on the login screen — The login page now shows your octoja version (for example v1.0.1314) just below the Sign in card. Click it to open the changelog and see what's new in this release.
  • More reliable single sign-on, and link accounts for users — Two single sign-on improvements. First, sign-in works for more setups: some providers (notably Microsoft Entra) send a sign-in token without an email address, which used to be rejected even when the account was correct. octoja now also checks the username the provider sends, so those people sign in normally. Second, an admin can link a single sign-on account to someone else's login on their behalf. Open a user in user management, and under Authentication → Linked Logins pick the provider and choose Link now — octoja runs the sign-in once and connects that identity to the chosen user, so their future logins are matched reliably instead of relying on a matching email address.

Fixed

  • Two-factor codes are now required with SSO — If you have two-factor authentication turned on, signing in through your SSO provider now asks for your authenticator code, just like a password login.
  • Automatic patch cycles no longer silently go missing — A ring's next patch cycle could quietly stop appearing, for example after a cycle was cancelled or a window passed without it running. octoja now always lines up the next cycle, and one whose window passed without running is clearly marked Missed instead of vanishing.
  • Patch cycles keep generating even with an odd ring schedule — An unusual maintenance-window schedule on one ring no longer quietly stops patch cycles from being generated, and the editor now warns you when none of a policy's rings has a valid window.
  • Known-issue advisories show in the catalog — Windows update advisories that flag a problematic update now correctly appear against the matching updates in the Update Catalog, instead of staying hidden.
  • Unmanaged devices keep their own Windows Update settings — Devices that aren't covered by any patch policy no longer have their built-in Windows Update settings taken over; octoja only manages updates on a device once a policy actually applies, and restores the original settings if it stops.
  • RAID check sees Intel RST arrays — On Windows machines with Intel RST or hardware-controller RAID, the RAID Status check no longer reports a false failure for a healthy array, and a machine with no arrays at all no longer shows a false failure either.
  • Network Interface check no longer fails on macOS — On Macs, the Network Interface check used to fail with an empty result; it now runs correctly and reports every interface on the device.
  • The "-" key types correctly on German keyboards — Connecting from a Mac to a Windows machine on a German layout no longer mistypes “-” and other punctuation keys.
  • Select and scroll again in remote terminals from a Mac — When connecting from a Mac, you can once again drag to select text and scroll inside a remote command window.
  • Sessions open without a false failure — Opening a remote-desktop, terminal, file-transfer, or log-download session could report “connection failed” even when it had actually opened. These now open without that false error.
  • Integration pages stay usable when a saved key goes bad — If a stored key for a ticketing or PSA integration became invalid, the whole detail page used to disappear, taking the Disconnect button with it. The page now renders through the error so you can always reconnect or disconnect.
  • Codemeta OS connection is checked before it's saved — Connecting Codemeta OS now confirms your token and address actually work and shows a clear error if they don't, instead of saving a broken connection that failed on every later use.
  • Customer matching no longer gets stuck — Saving customer matches for an integration could fail with a duplicate error you couldn't fix, because the conflicting entry belonged to a deleted customer. Saving now clears those stale matches so it goes through.
  • Device status filters span your whole fleet — Filtering the Devices list by Critical, Warning, or Healthy now searches every device rather than just the current page, and counts a device under each status it actually has, so a device with both a critical and a warning check shows up under either.
  • Rules and checks apply right after enrollment — A newly enrolled device's rule-driven tags and checks could take hours to appear; now a tag assigned by a rule immediately re-evaluates any check package or further rule that depends on it, so they show up within seconds.
  • No more failed-logon noise on your servers — On domain-joined and remote-desktop servers, every inventory cycle was logging repeated failed-logon and security warnings in the Windows event log. The agent now collects the same information without triggering them.
  • Delete a customer that has no devices left — Deleting a customer could fail saying it still had active devices even after you'd moved them all away; an empty customer now deletes cleanly.
  • Switching an open alarm's delivery now takes effect right away — If a check was still failing and you changed an alert channel's delivery — say, switching it to Teams or pointing it at a different ticket system — the new delivery used to stay silent until the check recovered and failed again. octoja now picks up the change immediately, so the next failure goes out through the new channel. The check editor also shows an active-alarm badge next to the alert summary when a config has open alarms.
  • Virtual machines now report their manufacturer and model — Some virtual machines, especially Hyper-V guests, were inventorying with an empty Manufacturer and Model, which broke rules that target devices by model. octoja now fills in these fields reliably, so model-based targeting works on those machines again.
  • Special characters work in your own checks — A custom PowerShell or shell check that contained special characters — umlauts like Lüfter, a degree sign like °C, or an em-dash — could come back garbled, and in some cases broke the check entirely. It was worse for a saved check: it could fail when it actually ran even though the Test on its editor page looked fine. octoja now runs these scripts with the right text encoding, so the characters you typed in Custom Checks are exactly what runs on the device. Saved checks pick up the fix automatically — no agent update needed.

June 22nd, 2026

New

Improved

Fixed

Highlights

This release is all about connecting octoja to the rest of your stack. Six antivirus and EDR platforms, nine helpdesk and PSA systems, and two documentation tools can now be wired straight into octoja — so protection status, alarm tickets, and your asset inventory stay in sync without manual work. Alongside that: a one-glance executive report for your customers and a new check for UniFi networks. The rest is polish and reliability — clearer patch policies, sortable tables, and a batch of cross-platform fixes for macOS and Linux.

New

  • Antivirus & EDR integrations — Connect Bitdefender GravityZone, Sophos Central, ESET PROTECT, Securepoint Antivirus Pro, ThreatDown, and SentinelOne. octoja pulls each platform's protection status — such as agent health, definition currency, real-time protection, and active threats — and surfaces it as a check, so unprotected or at-risk devices show up next to everything else. Marked BETA.
  • Helpdesk & PSA integrations — Open a ticket automatically when a check alarms and close it on recovery, across DocBee, HaloPSA, Autotask, Inserve, Odoo Helpdesk, Jira Service Management, TOPdesk, TANSS (BETA), and Codemeta. Most also map your customers and sites and sync devices into the connected system.
  • Documentation sync: IT Glue & Hudu — Sync your octoja devices straight into IT Glue Configurations or Hudu Assets, kept up to date automatically per customer.
  • Executive report — A new customer-scoped report (Chefbericht) that opens with an at-a-glance scorecard — devices online, patches current, AV protection, backups, and monitoring — followed by the key metrics and the proactive work done during the period. Built to hand straight to a customer's management.
    Executive report
  • Access overview — A new admin page that shows who can access which customers and devices, and why — by user, by customer, or by device, including the groups that grant the access.
    Access overview
  • UniFi network check — A new check monitors Ubiquiti UniFi switches, gateways, and access points over SNMP, on Windows, macOS, and Linux.
  • Remote-desktop resolution control — Change the resolution of the Windows display you're remoting into, right from the session settings, applied live.
  • View Reports permission — A new permission lets you grant read and run access to reports separately from the ability to manage report templates.

Improved

  • Integrations grouped by category — The connected-platforms area now groups integrations by what they do and floats your connected platforms to the top, so the list stays readable as it grows.
    Integrations grouped by category
  • Sortable admin tables — The email, webhook, and Teams channel tables and the patch-cycle tables can now be sorted; severity sorts by rank rather than alphabetically.
  • Clearer patch policies — The Auto-Promotion and Exclusions sections of a patch policy now explain in plain terms what each setting does, with a hint on every threshold.
    Clearer patch policies
  • Hide disabled checks — In a device's Checks tab, disabled checks are now hidden by default, with a “Show disabled” toggle to bring them back.
  • Richer Teams alert cards — Teams alerts now carry the same detail as email: device and customer context, the check's output, and a button that jumps straight to the device — in the channel's language.
  • Clickable customer & site in the breadcrumb — On a device page, the customer and site in the navigation path are now links that open a device list already filtered to that customer or site.
  • Cadence-aware backup age (Veeam) — The Veeam backup-age check can now derive the expected age from each job's schedule, so weekly or monthly jobs no longer false-alarm just for running less often. Fixed thresholds remain the default.
  • Localized keyboard shortcut hint — The search shortcut hint is now localized — German shows Strg+K instead of Ctrl+K.
  • Links use your own domain — The device links in alarm emails and integration tickets now use your tenant's own domain when you've set one, instead of the default octoja address.
  • Tag rules apply immediately — Creating a tag rule now tags all matching devices right away, instead of waiting for each device's next check-in.

Fixed

  • macOS & Linux user details — On macOS and Linux, the user-account check no longer shows “Unknown” for last login, the Local users table now fills in Last login and Password last set, and the live status column shows who is currently logged in.
  • Remote NumLock left alone from a Mac — Controlling a Windows machine from a Mac no longer silently switches the remote NumLock off, which had broken click-and-drag text selection.
  • macOS agent uninstall — Removing a device now fully uninstalls the agent on macOS, instead of reporting success while leaving files behind.
  • Report PDF layout — Report PDFs no longer overlap widgets or split them awkwardly across page breaks.
  • Customer matching in integrations — Deleting a matched customer no longer breaks an integration's matching dialog, so you can save your customer assignments again.
  • Synology check — A healthy Synology NAS is no longer falsely reported as 100% full, and RAID status is now read correctly.
  • Email channels in the check dialog — Email recipients in a check's alert summary are now labeled correctly — they previously showed as “Webhook” — and show the inactive badge when disabled.
  • SNMP custom checks report the cause — Simple-mode SNMP custom checks now show why they failed instead of a bare “Failure”, and no longer report success when the community string is wrong or the value doesn't exist.

June 13th, 2026

New

Improved

Fixed

Highlights

This is a major release spanning everything since v1.0.701. You can now control access through groups, get notified when a monitoring check keeps failing — by email, webhook, Microsoft Teams, Woasi or as a case in octoja — and patch your Macs alongside Windows. octoja now speaks French and Dutch as well as English and German, a new Inventory page searches and exports across your whole fleet, and five new built-in checks cover server hardware, Hyper-V hosts and three backup products. On top of that: bulk customer import, a clearer customer dashboard and customers overview, a searchable device logs tab, per-device alert overrides, a detailed patch report, and a long list of fixes across remote desktop, monitoring checks, uploads and the customer dashboard.

New

  • Group-based access control — You can now control what each team sees and does through groups. A group defines which customers its members can reach — everyone, a specific list, or by customer tag — and which devices and device actions they are allowed, so you can give a help-desk team read-only access to one customer's workstations without touching anyone else.

    Group-based access control
  • Alerts for your monitoring checks — You can now attach alert rules to a monitoring check in a configuration package and be notified when it keeps failing — by email, a webhook, Microsoft Teams, Woasi, or as a case in octoja. Each rule only fires when a check fails a set number of its last few runs, so a single blip does not wake you up.

  • French and Dutch language support — octoja is now available in French and Dutch as well as English and German. Both new languages appear automatically in the login and profile language switchers and cover the interface, the API and check results.

    French and Dutch language support
  • Search and export inventory across all your devices — A new Inventory page lets you search, filter and export your software, hardware and services across every device at once — a fleet-wide companion to each device's own inventory tab.

    Search and export inventory across all your devices
  • Five new built-in monitoring checks — Five new checks are available without writing a custom script: Fujitsu ServerView server hardware, Microsoft Hyper-V hosts, and backups from Altaro, Acronis and the Veeam Agent for Windows.

  • Patch management for macOS — macOS updates now flow through the same patch policies and cycles you already use for Windows. A single rollout can target a mixed fleet of Windows and Mac devices, and each machine only receives the updates meant for its operating system.

    Patch management for macOS
  • Import customers from CSV or Excel — A new Import customers action on the customers page lets you bring in many customers at once from a spreadsheet, mapping your columns — company name, reference, address and contact — to octoja's fields, so onboarding no longer means adding customers one by one.

    Import customers from CSV or Excel
  • Hardware inventory report widget — A new report widget lists one row per device and lets you pick exactly which hardware fields to include — from processor and memory to identity and storage. You can also set a report's page orientation to landscape so wide tables fit.

  • A welcome dialog for new users — New users now get a friendly welcome dialog on their first sign-in that introduces octoja and previews what is coming next.

    A welcome dialog for new users
  • Auto-lock a machine when a remote session ends — Remote desktop sessions can now lock the remote computer the moment you disconnect, so a workstation is never left unlocked after you finish working on it. The option is off by default and enabled per session.

Improved

  • Searchable, sortable customers overview — The customers page gains a search box, new Server and Workstation columns showing how many devices each customer has, and every column can be sorted — so a long customer list stays manageable.

    Searchable, sortable customers overview
  • A clearer, clickable customer dashboard — A customer's dashboard adds tiles for newly enrolled and currently offline devices, and the Warnings, Critical, Server and Workstation tiles are now clickable. Each one opens the device list pre-filtered to that customer and status, so you go from a number straight to the exact devices.

    A clearer, clickable customer dashboard
  • A searchable, sortable device logs tab — A device's Logs tab is now a proper paged table — sortable, searchable and filterable — instead of a flat, capped list, so finding a specific entry is much easier.

    A searchable, sortable device logs tab
  • Per-device alert overrides — You can now give a single device its own alert configuration, or silence its alarms while the check keeps running, instead of sharing one configuration across every device a package targets. The alert editor also flags a channel that has been disabled, so alerts are not silently dropped.

  • A detailed patch report, plus date ranges for reports — A new Detailed Patch Report shows, per customer or site, which devices installed which patches and when, and which are still pending. Reports also gain a custom date-range selector.

  • More backup and firewall monitoring — The Veeam check is upgraded to Veeam Backup & Replication with richer job detail (existing assignments keep working), and the firewall check now monitors FortiGate appliances over SNMP for live metrics, not just reachability.

  • Sort the live process list by any column — The live processes view used to always sort by memory. You can now sort by any column in either direction, and the sorting happens on the device so even long process lists stay responsive.

  • A smarter check-type filter on the dashboard — The dashboard's check-type filter now reflects every check type in your fleet instead of only the ones on the current page, so picking a check type no longer makes the other options disappear.

  • Deploy Mac apps that ship as Homebrew casks — Software deployment now finds Homebrew casks, not just formulae, so graphical apps like Google Chrome, Slack and Visual Studio Code show up in the package catalog and can be rolled out to your Macs.

  • Easier mass-deployment through group policy — The group-policy rollout now gives you a ready-made transform file that carries your instance address and token, plus corrected step-by-step instructions, so deploying the agent to many machines via group policy works the way the guide says.

  • Better support for older and lower-spec Windows machines — The quick-install script now runs reliably on Windows Server 2012 R2 and other older Windows versions. Separately, remote desktop now connects to machines with very few processor cores instead of failing immediately.

Fixed

  • Accurate alarm history on the customer dashboard — The customer dashboard's alarm history counted every check run rather than distinct alarms, so a single all-day alarm could inflate a day's total into the hundreds. It now counts actual alarms, and the tile layout is tidier.

  • Devices no longer get stuck showing offline — A device could occasionally show offline for hours while it was actually online, when its connection attempt was silently dropped by the network. The agent now detects a stalled connection and retries instead of waiting forever.

  • Clearer Windows Update check failures — The Windows Update check could show a red Failed status next to “No pending updates” — two contradictory messages — when it had actually crashed. It now reports the real reason it failed.

  • Large file uploads no longer crash — Uploading a multi-gigabyte file through the file explorer could fail partway through. Uploads now flow in a controlled way and complete reliably.

  • A batch of custom-check fixes — Several fixes for custom checks: corrected Warning and Critical status guidance, multi-line script output handled properly, stable input ordering, a scrollable check dialog, and SNMP probes no longer reject an OID because of stray whitespace.

  • Remote desktop no longer zooms in on high-DPI screens — On some machines a remote desktop session appeared zoomed in and cropped to the top-left corner. The picture now fills the screen correctly.

  • A more reliable clock-sync check — When the clock-sync check could not reach a time server, it used to show a misleading result with a bogus timestamp. It now reports a clear error, and the time offset is calculated correctly.

  • The Update button works in the software dialog — On a device's software dialog, clicking Update for a winget or Chocolatey package sometimes did nothing. The update now runs and reports its result.

  • No false antivirus alerts right after a reboot — The antivirus check could briefly report Critical right after a machine powered on, even though protection was fine. It now waits for antivirus to settle before judging.

  • Ignored Lywand vulnerabilities no longer count toward your score — Marking a vulnerability as ignored in Lywand now actually removes it from your octoja security score and report figures, instead of being dropped before it reached octoja.

June 6th, 2026

New

Improved

Fixed

Highlights

This release puts more control in your hands across patching, monitoring and the dashboard. You can now block a specific Windows update across every device, see vendor and community advisories right in the update catalog, and disable or fine-tune a monitoring check on a single device without touching the rest of its group. The device dashboard gains update-status filtering and per-column header filters, a device's logs are one click away, and you finally get a proper overview of your installation tokens. The rest is polish and reliability — checks run on their real schedule again, copy and paste works in the terminal, large installers no longer run out of memory, and servers stop showing up as workstations.

New

  • Block a Windows update across every device — You can now block a specific Windows update by its KB number so octoja never installs it on any device. The update catalog also surfaces advisory information — vendor known issues and community reports — so you can see whether an update is known to be problematic.
    Block a Windows update across every device
  • Filter the device dashboard by update status — The dashboard gets a filter for device update status — Pending, Current, or Unknown — and the device table's column headers now carry their own filter popovers for update status, OS and role, and online state.
    Filter the device dashboard by update status
  • Disable or override a check per device — You can now turn off a monitoring check on a single device, or override its settings just for that device, without affecting the other devices the config package targets.
  • Download a device's logs in one click — A new Download logs action on the device page bundles the agent's logs into a single zip and downloads them straight to your browser — no more digging through the Files tab to find where logs live.
    Download a device's logs in one click
  • Installation-token overview with revoke — A new admin page lists your installation tokens, shows how much each has been used, and lets you revoke ones you no longer want. The deployment wizard no longer quietly creates a throwaway token every time you open it.
    Installation-token overview with revoke
  • Choose your start page — In your profile you can now pick which page you land on after signing in — Dashboard, Cases, Devices, Customers or Patch Cycles; single sign-on logins still open the dashboard. There's also a new option to open devices in a new browser tab.
    Choose your start page
  • Change a device's type — Devices are classified as Server or Workstation automatically from their operating system, but you can now correct that from the device menu when a workstation is actually used as a server, or the other way around.
    Change a device's type
  • Custom window title for white-label instances — Admins can now set the browser tab title to their own product name instead of octoja, and the branding page is reorganised into clearer sections.
    Custom window title for white-label instances

Improved

  • Read-only access to Cases — Cases now have a separate read-only permission, so you can give someone visibility into cases without granting the rights to create, edit or comment.
  • Richer live process list — The device's live processes tab now shows current CPU usage, committed and paged memory, thread and handle counts alongside the existing columns, and sorts by memory use so the heaviest processes surface first.
  • User Account check: full inventory and history — The User Account check now lists every account on the machine with enabled, admin, locked and inactive breakdowns, highlights the flagged ones, and keeps a per-run history with a trend of accounts added or removed over time.
  • The SMART check explains why a disk failed — When a disk reports a problem, the check's detail view now names the exact condition that tripped — a failing attribute, an over-temperature reading or a drive's own self-assessment failure — instead of just showing a red status. Check results across the built-in checks now appear in your language too.
  • NVMe-aware disk temperatures — The SMART check now uses higher warning and error temperatures for NVMe drives, which run hotter than hard drives by design, so healthy NVMe drives no longer trip false alarms. Both thresholds stay configurable.
  • Dashboard columns follow your check filter — When you filter the dashboard by specific checks, the grid now shows only those checks as columns instead of every check the matched devices happen to have, so the status you filtered for is immediately obvious.
  • Consistent check-type names on the dashboard — Dashboard check filters and columns now label each check by its canonical name in your language, so the same check no longer appears under different names depending on which language a device was configured in.
  • Service picker shows friendly names — In the Service Status check, the service picker's dropdown now shows the friendly display name with the underlying service name in brackets, while the selected chips always show the exact stored value — so the label reads the same whether you edit the check on a device or in a config package.

Fixed

  • Checks run on their real interval — A check set to run less often than every 30 minutes — such as a daily User Account audit — was quietly running every 30 minutes instead. Checks now honour their configured interval.
  • Custom-package parameters are saved and editable — Per-deployment parameter values for a custom software package could be silently dropped on save, couldn't be viewed again, and were wiped when you edited the deployment. They're now stored reliably, shown when you reopen the deployment, and kept when you make changes.
  • Copy and paste in the device terminal — Copy and paste now work in the device toolbox terminal on Windows and Linux. Ctrl+C and Ctrl+V used to print control characters instead of copying or pasting.
  • Large installers no longer run out of memory — Creating a custom software package from a large MSI installer could fail with an out-of-memory error before the upload even started. Large installers are now processed in small pieces and go through reliably.
  • Servers classify correctly from the start — Some Windows Server machines were initially shown as workstations. They are now identified as servers from the moment they enrol.
  • Inventory saves no longer fail on unusual characters — A stray character picked up from a device — for example in an installed program's name — could make that device's inventory fail to save over and over. Those characters are now handled cleanly so inventory saves through.
  • Cleaner Veeam check errors — When the Veeam module couldn't be loaded, the Veeam Backup check used to surface a long block of garbled text as its error. It now reports a clear, readable message.
  • "Update all" stops flagging benign results as errors — Patching all packages with WinGet or Chocolatey marked packages that were already current as red errors, and occasionally invented phantom “updated” lines. Each package's result is now reported accurately.
  • Custom Linux checks handle multi-line output — A custom check on Linux that returned multi-line output — for example the result of a command like ifconfig — used to fail. Such checks now run correctly.
  • Homebrew installs on a fresh Mac — Deploying a Homebrew package to a Mac that didn't already have Homebrew failed, even for administrator accounts. The install now completes reliably.
  • Cleaner Linux inventory — On Linux, apt package names no longer show stray quote characters before them, and virtual container filesystems no longer appear as empty 0-byte drives in the device's storage inventory.
  • Network Interface check keeps the real adapter on Hyper-V guests — On a Hyper-V virtual machine, the check's “exclude virtual adapters” option wrongly hid the machine's real network adapter and reported no interfaces. The real adapter is now kept while genuinely virtual ones stay filtered.
  • Day names in the schedule picker — The monthly weekday selectors in the schedule picker showed raw placeholder text instead of day names. They now show the correct localised day names.
  • Report builder wraps long widget names — Long widget names in the report editor's widget palette were cut off mid-word. They now wrap onto a second line so you can read the full name.
  • More accurate Lywand tracking — Whether a device is tracked by Lywand is now read directly from Lywand's own list of scan targets, instead of being inferred. This stops a device from being scored against a foreign Lywand account and lets clean scanned machines rank correctly.

June 3rd, 2026

New

Improved

Fixed

Highlights

This release brings time tracking to cases: you can now log work against a case the same way you already do against a device. The Windows Update check grows into a true cross-platform System Updates check that also covers Linux and macOS, and FortiGate joins the firewall appliance check. The rest is polish and reliability — the Veeam check stops crying wolf on busy backup servers, the Storage Analyzer stays smooth on huge disks, Chocolatey deployments repair themselves, and the rule builder counts the right devices when you pick a customer.

New

  • Time tracking on cases — You can now track time against a case, not just a device. A new Tracked Time card on the case lets you add entries by hand, link or unlink existing device entries, and see the total time logged at a glance. Time without a device — pure case work — is fully supported too.
    Time tracking on cases
  • Clone an existing custom check or config package — Both creation dialogs now have a Clone from picker: pick an existing check or rule-based config package as a starting point, give it a new name, and octoja copies everything over for you. Handy for spinning up variants without rebuilding them from scratch.
  • FortiGate in the firewall check — The firewall appliance check now covers FortiGate alongside OPNsense, WatchGuard and Sophos XG. It keeps an eye on the firmware version, flags available upgrades, and warns you before the license expires. You can also set a custom port for OPNsense, in case its interface isn't on the standard HTTPS port.
  • Combined threshold mode in the Disk Space check — The Disk Space check gets a third mode, Combined, that only alerts when both the used-percentage and the free-space limit are crossed. No more false alarms on very large disks, where a high percentage can still leave plenty of room free.
    Combined threshold mode in the Disk Space check
  • Unsupported-browser warning at login — If you sign in with Firefox, Safari or another non-Chromium browser, the login page now warns you up front. Dismiss it once and it stays out of your way for 24 hours.

Improved

  • System Updates check now covers Linux and macOS — The Windows Update check now works on Linux and macOS too, reporting pending OS updates across all the common package sources. A new Security updates only toggle lets you focus on what matters most, the same way on every platform.
  • Inventory now covers SUSE and Arch Linux — Software and pending-update inventory now report from SUSE / openSUSE and Arch hosts as well. They used to show up empty or without any update count.
  • SNMP v3 for the built-in SNMP checks — The APC UPS, HP iLO, QNAP and Synology checks now support SNMP v3 alongside v2c. Pick the version in the check's settings, and the matching credential fields — user, authentication and privacy — appear when you choose v3.
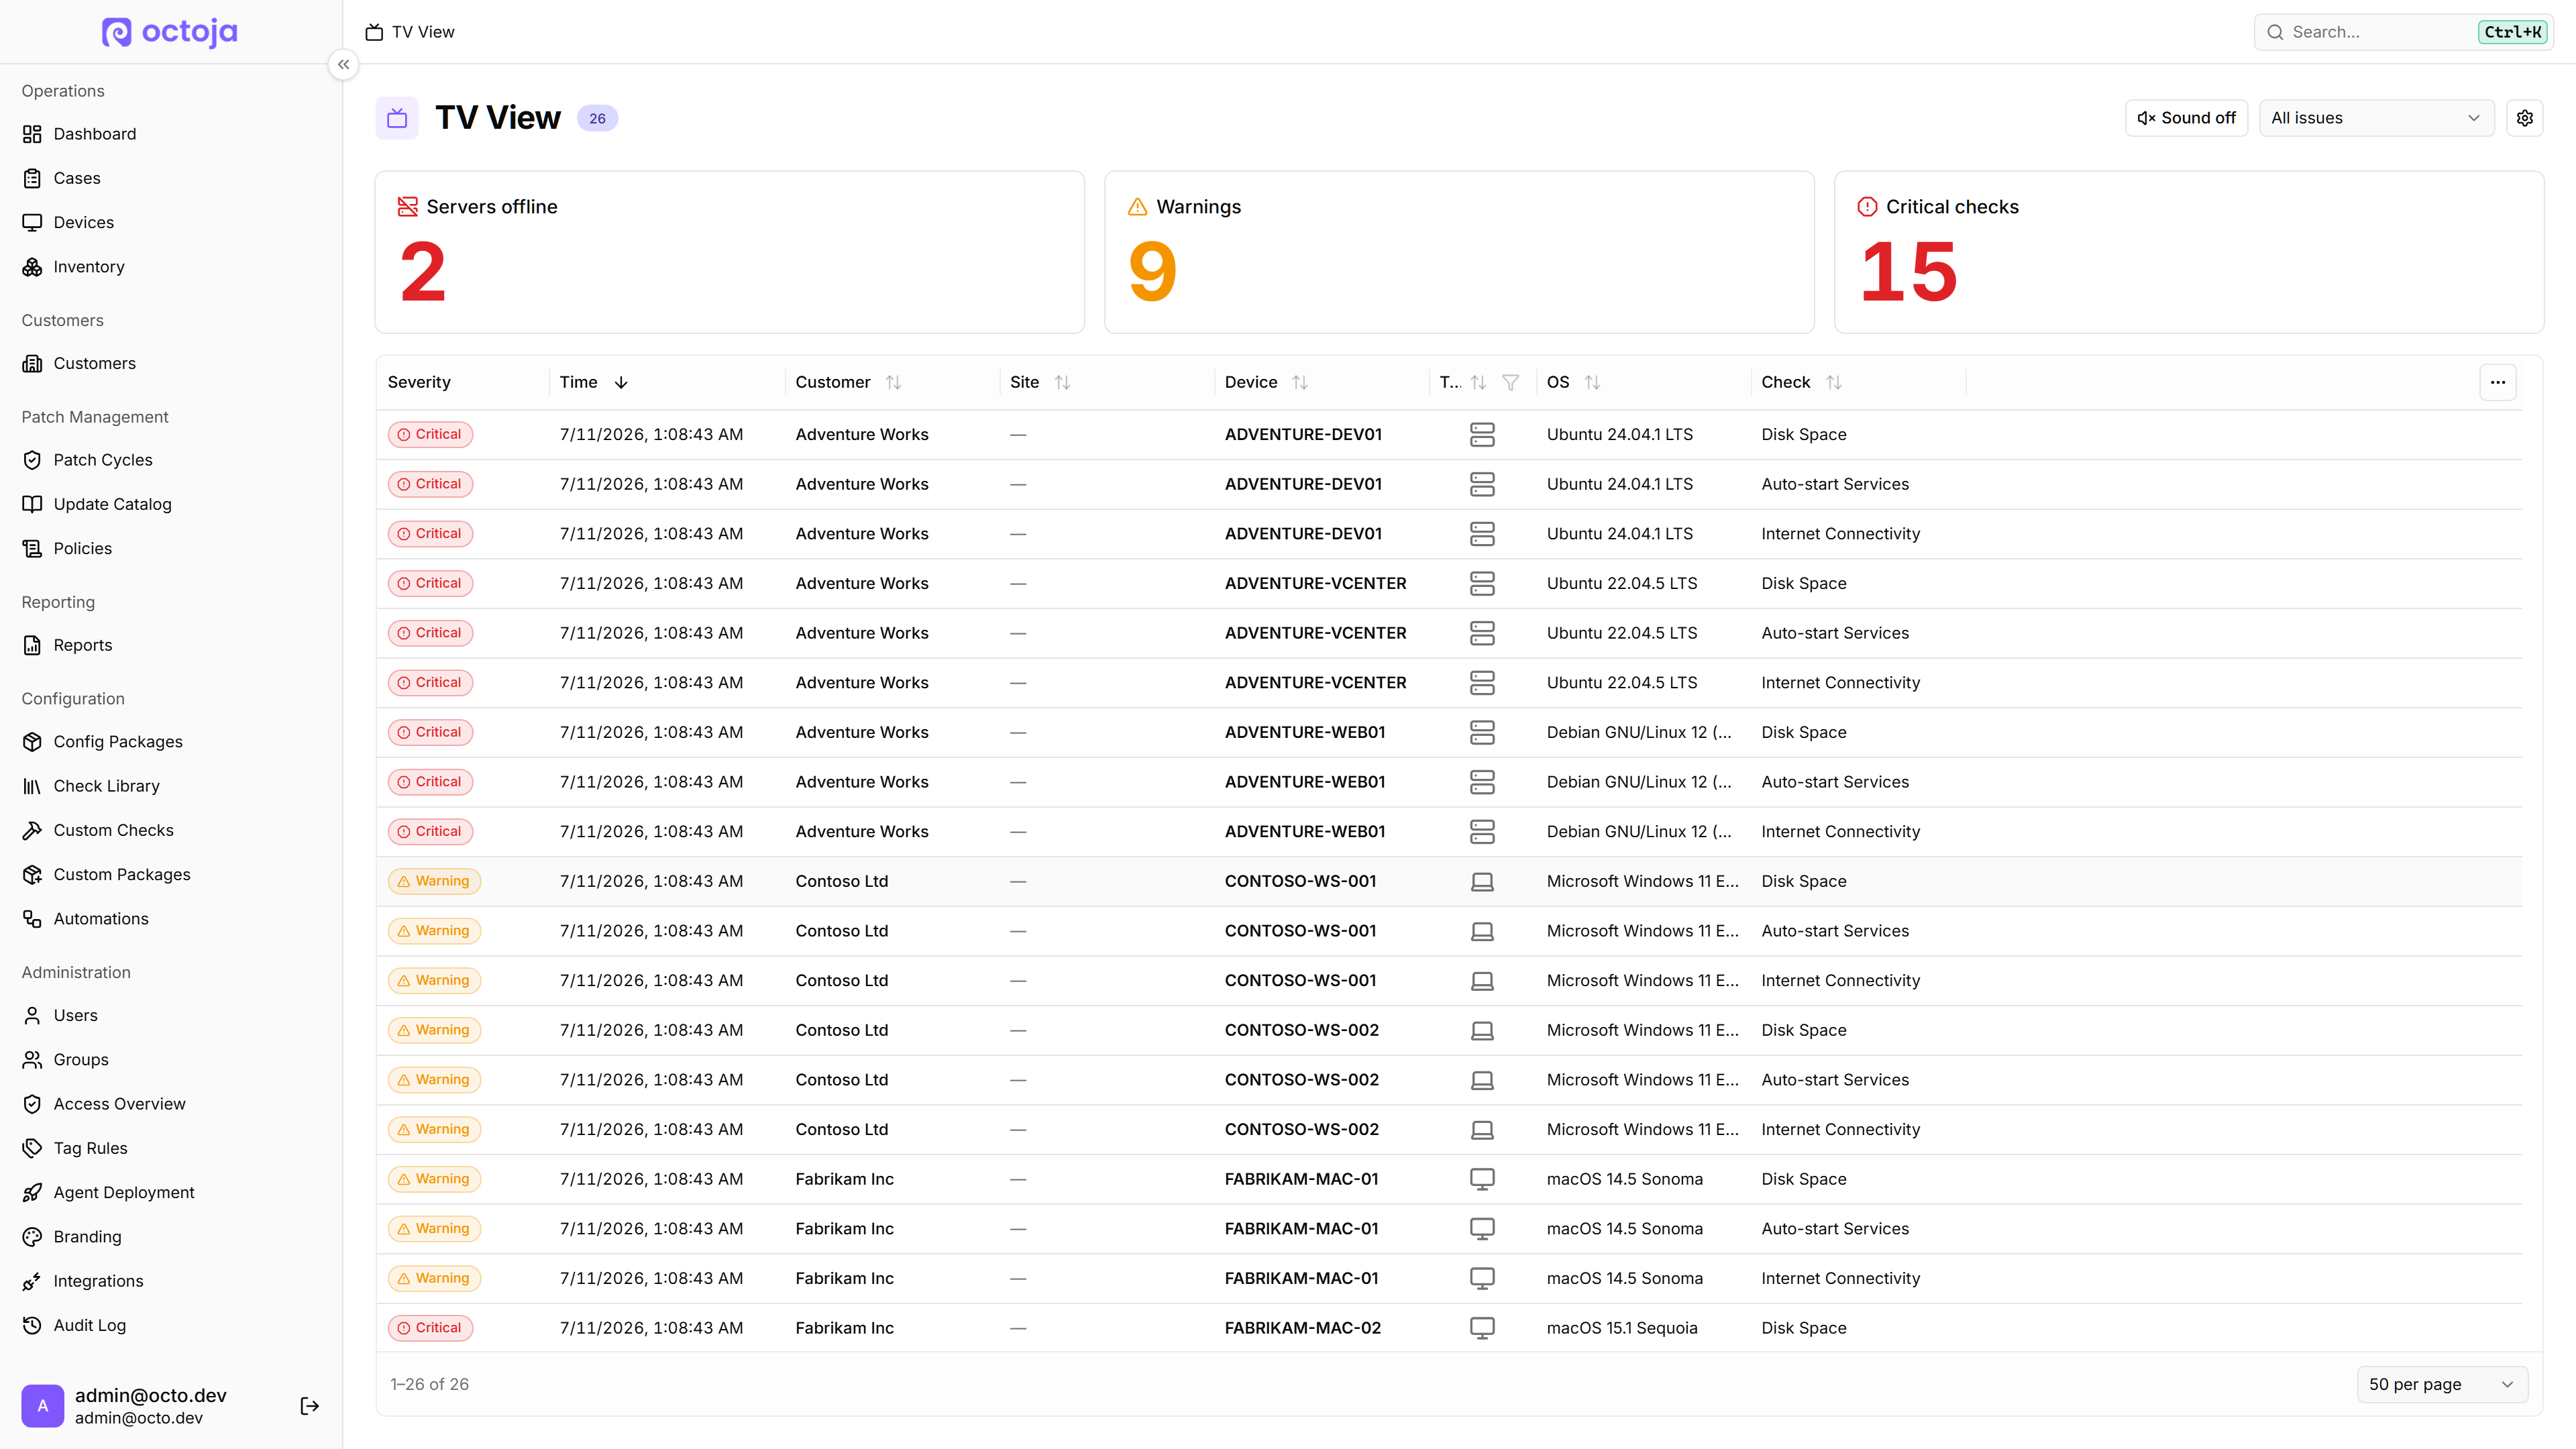
  • Patch-policy rings are collapsible — Patch policies with several rings were hard to scan when every ring stayed fully expanded. Saved rings now start collapsed for a compact overview, while new ones stay open so you can finish setting them up.
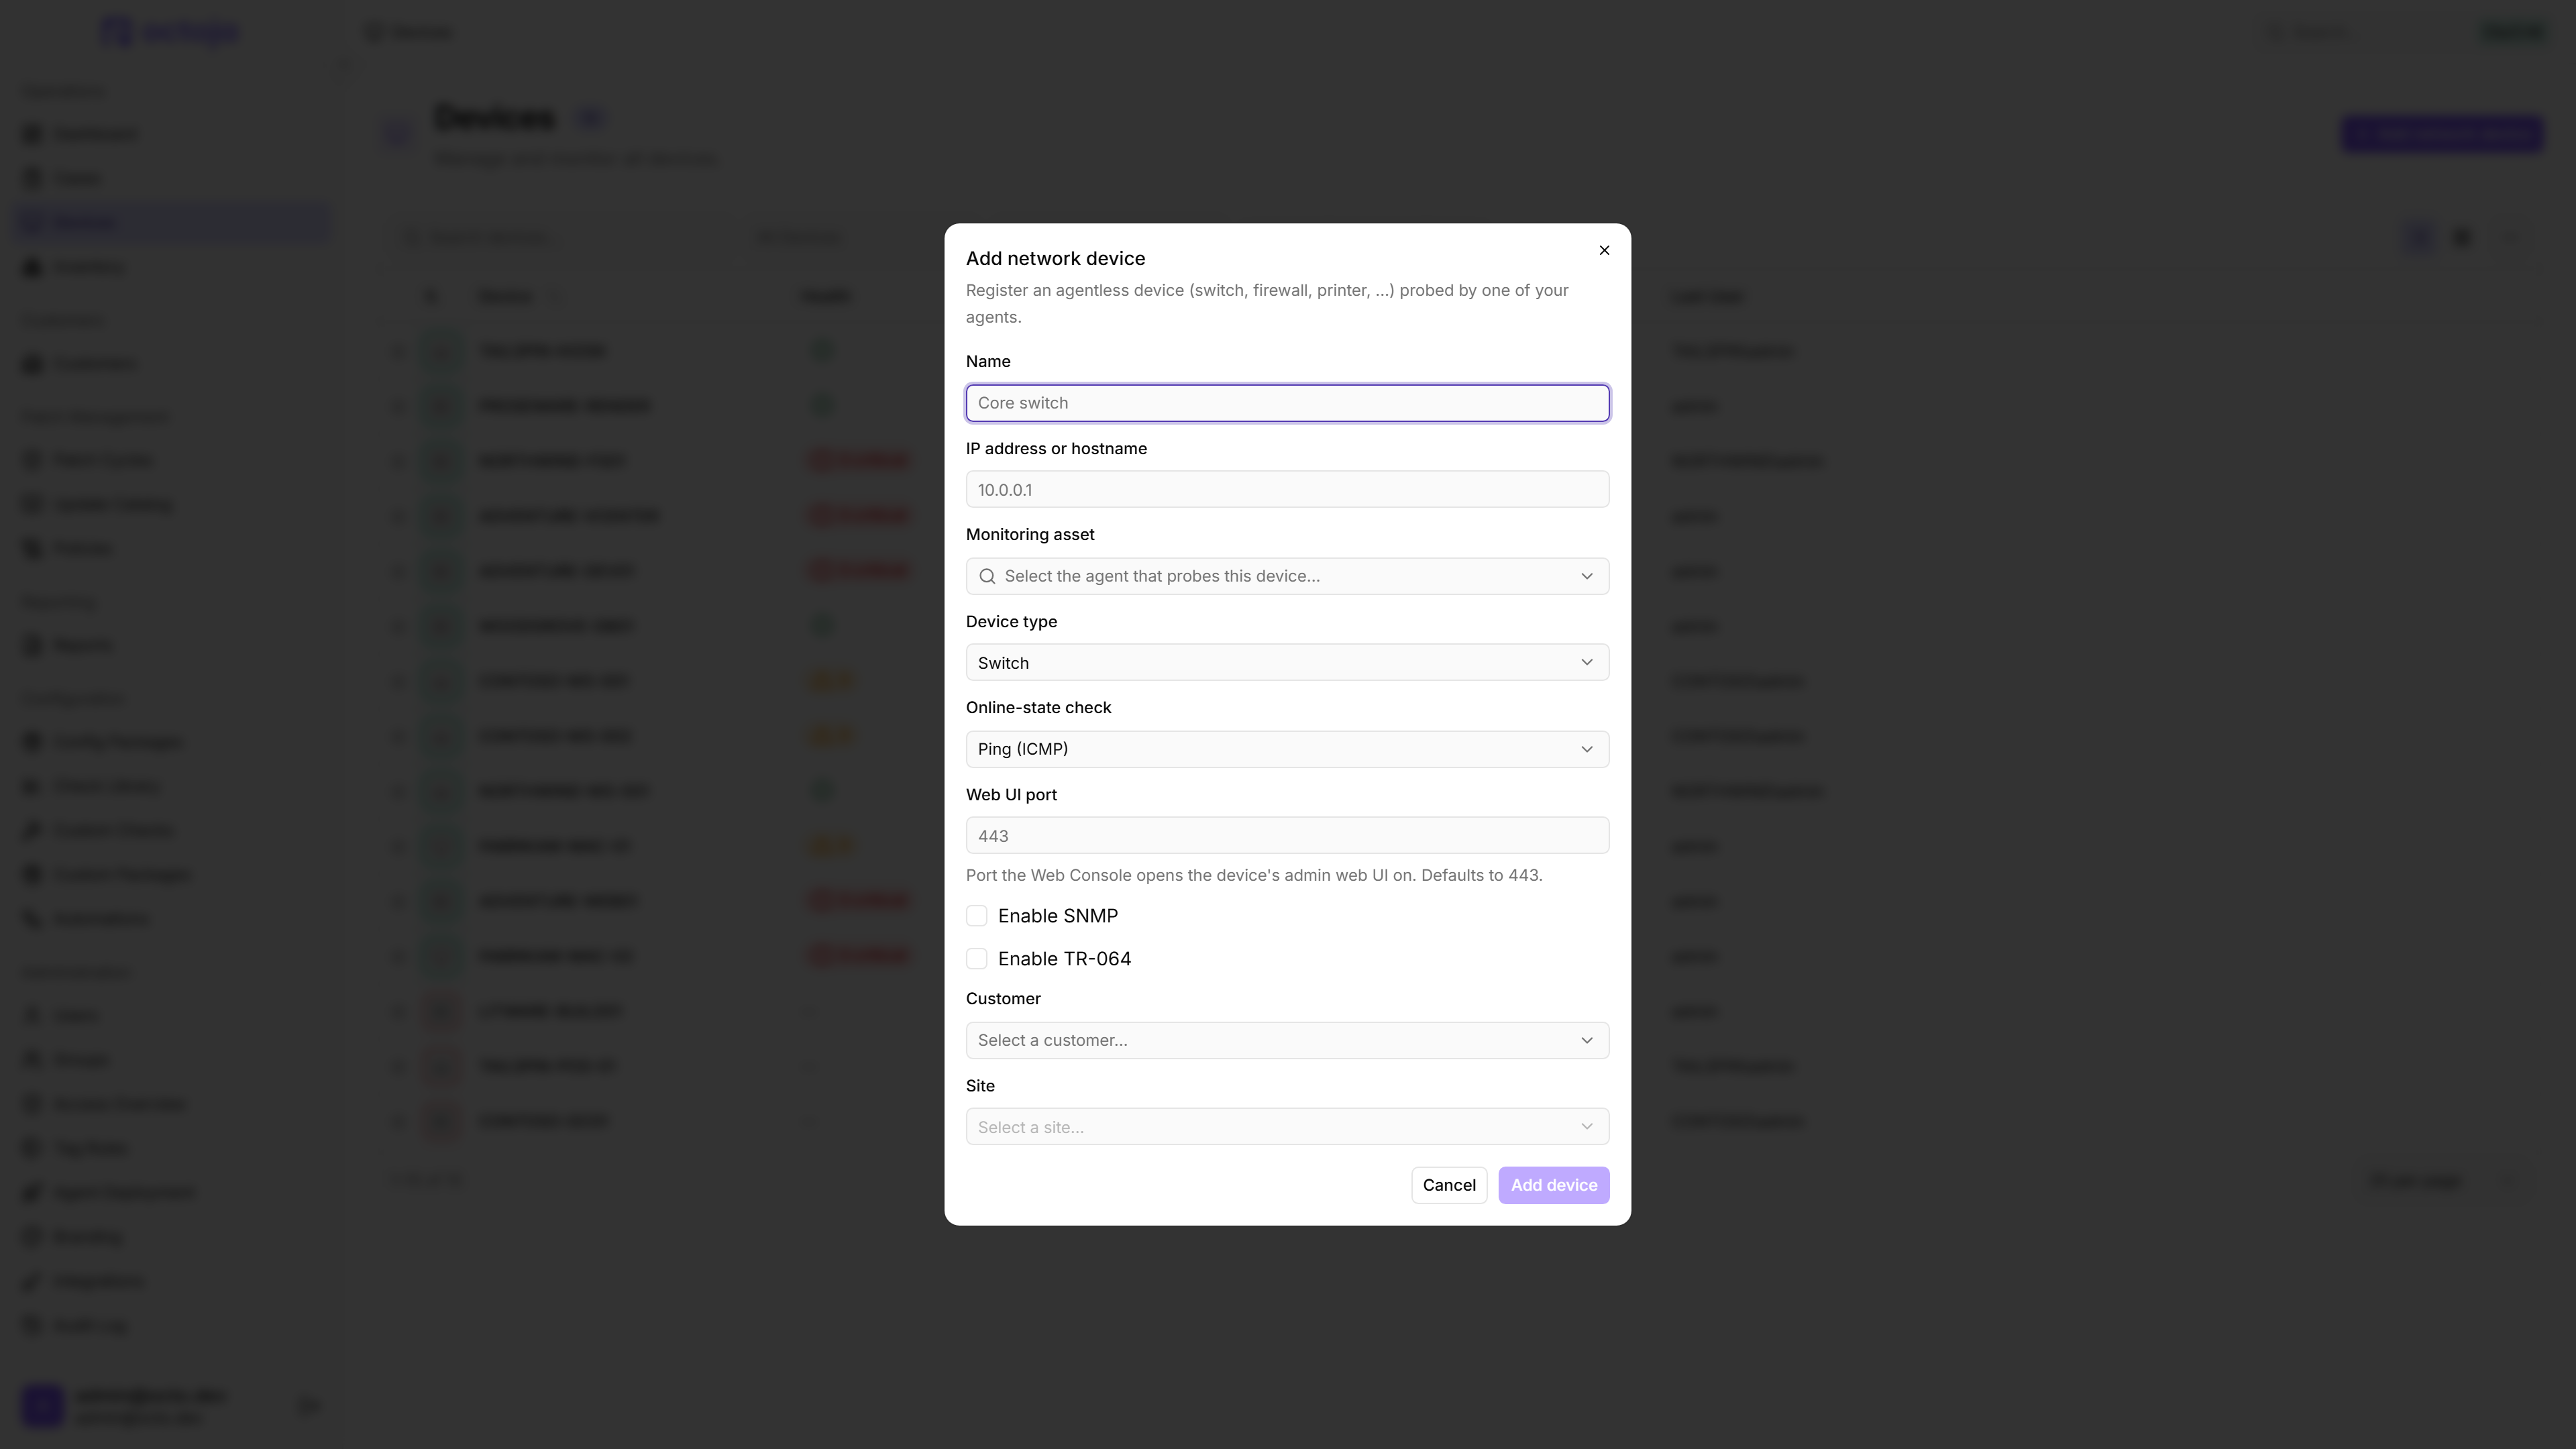
    Patch-policy rings are collapsible
  • More reliable software deployment with WinGet — WinGet deployments that failed on some devices now go through reliably. Installs for a single user run with that user's rights, while system-wide installs use the admin rights they need.
  • Withdrawn updates get their own status — Updates that the vendor has pulled now show up under a separate Withdrawn status in the update-spread radar and the update detail view, instead of being mixed in with other states you can't act on.
  • Admin groups get new permissions automatically — You can now mark a group as an administrator group. Whenever a future octoja release adds a new permission, every admin group gets it automatically — no more adding it to your admin group by hand after each upgrade.

Fixed

  • Veeam check false positives — On busy servers the Veeam Backup check could report no backup jobs found even when there were plenty, and it flagged weekly or monthly Backup Copy Jobs as critical just because of their age. It now handles large job histories correctly, judges each job type by a sensible age, and shows the real reason from Veeam when a job warns or fails.
  • Storage Analyzer no longer hangs on large scans — On disks with tens of thousands of files, the Storage Analyzer tab in the device toolbox could freeze. It now stays smooth no matter how large the scan gets.
  • Inventory works again on macOS and Linux — Inventory was failing on every cycle for macOS and Linux agents, so those devices never reported their hardware and software. It now runs normally on all platforms.
  • macOS install with Open Deployment — Installing the agent on macOS could fail when you used Open Deployment — the enrollment mode where devices join without a token. It now installs reliably.
  • Chocolatey deployments recover from a broken install — Software deployments through Chocolatey now work no matter where Chocolatey was installed. If a previous Chocolatey install was left broken or half-finished, octoja now repairs it automatically instead of failing on every attempt.
  • Permission fixes for non-admin users — Some pages broke for users without management permissions — the dashboard could fail to load and a device's Checks tab showed empty. The dashboard, the Checks tab and the report-draft preview now work for everyone, and a device's action buttons only appear when you actually have permission to use them.
  • Rule builder counts devices correctly per customer — In the config-package rule builder, picking a customer after creating a rule used to show 0 matching devices. It now shows the right count whether or not a customer is selected.
  • Installs and self-updates cope with antivirus scans — Agent installs and self-updates occasionally failed with an access-denied error when antivirus locked a freshly-written file to scan it. octoja now waits a moment and retries, which clears the rare conflict.

June 1st, 2026

New

Improved

Fixed

The changelogs are sent out on the same day as the scheduled updates to the product and other components such as checks. Due to the staggered rollout and decoupled components, timing differences occur here.

New permissions, such as those for OS patch management, currently have to be assigned manually. We are already working on an admin logic that will assign these permissions automatically in the future.

Highlights

This release brings OS Patch Management directly into octoja: schedule install windows per device group, choose which update categories run, keep an eye on reboots, and see withdrawn updates broken out separately. Alongside that, a long list of smaller-but-tangible improvements — kick off agent updates straight from a device's detail page, give every device a freeform alias, paste your clipboard into a remote-desktop session in one click, get a much richer hardware inventory, and pick up built-in checks for Cove Backup, MailStore SPE and a range of hardware firewall appliances.

New

  • OS Patch Management — octoja can now install Windows updates on your managed devices. Schedule a maintenance window per device group (time-zone aware), pick which update categories should run, and let octoja take it from there — reboot detection, a dedicated patch-cycle view, and a separate status for withdrawn updates are all built in. Reboots are written to the asset log so you can see exactly when a device last cycled.

    OS Patch Management
  • Trigger agent updates from a device's detail page — When a device is running an older agent than the current build, octoja now shows an alert and an **Update now** button at the top of the device detail page. Clicking it kicks off the update immediately instead of waiting for the agent's next scheduled check.

  • Device alias — You can now give devices an alias. The command palette then matches the device on either the hostname or the alias.

    Device alias
  • Paste button in remote desktop — Remote desktop sessions now have a **Paste** button that types the contents of your clipboard into the remote machine — handy when the remote side doesn't accept normal paste shortcuts.

  • Cove Backup check — New built-in check that reads the status of your Cove Backup jobs (formerly N-able Backup) directly from the Cove API and surfaces it as a check result in octoja.

  • MailStore SPE check — New built-in check for MailStore Service Provider Edition, monitoring the health of your mail archives.

  • Multi-vendor firewall appliance check — New built-in check for hardware firewalls across multiple vendors — octoja pulls health and configuration status via each vendor's API.

Improved

  • Live uptime on the device detail page — A live-updating uptime badge now sits next to the boot time, so you can see at a glance how long a device has been running.

  • Battery health in the Power Status check — The built-in Power Status check now reports battery health alongside remaining capacity and cycle count, so you can spot aging batteries earlier.

  • Richer hardware inventory — Hardware inventory now includes L2 cache size, every physical drive, full network adapter details, and the start-type of each Windows service. Volumes are mapped to their physical disks, and duplicate network adapter entries are merged so the list stays readable.

  • Local users with login and password dates — Local users in the System tab now show their last login and last password-change date — plus whether the device is joined to a domain, Azure AD, or just a workgroup.

  • Feedback launcher moved — The feedback launcher in the bottom-right has shifted slightly so it no longer covers floating action controls.

Fixed

  • Custom check reliability — Several fixes around custom checks: edits to a check are pushed to affected agents immediately, the check result is now cleanly isolated from anything the script writes to stdout, the live-test panel surfaces unparseable output instead of hiding it, and checks still report a result when the script exits early.

  • Time entries keep their comment — Time entries shorter than 30 seconds used to lose their comment when stopped. Comments are now saved regardless of session length.

  • Case-insensitive dashboard sort — Customers and sites on the dashboard now sort alphabetically without splitting lower-case entries below the upper-case ones.